Note
Click here to download the full example code
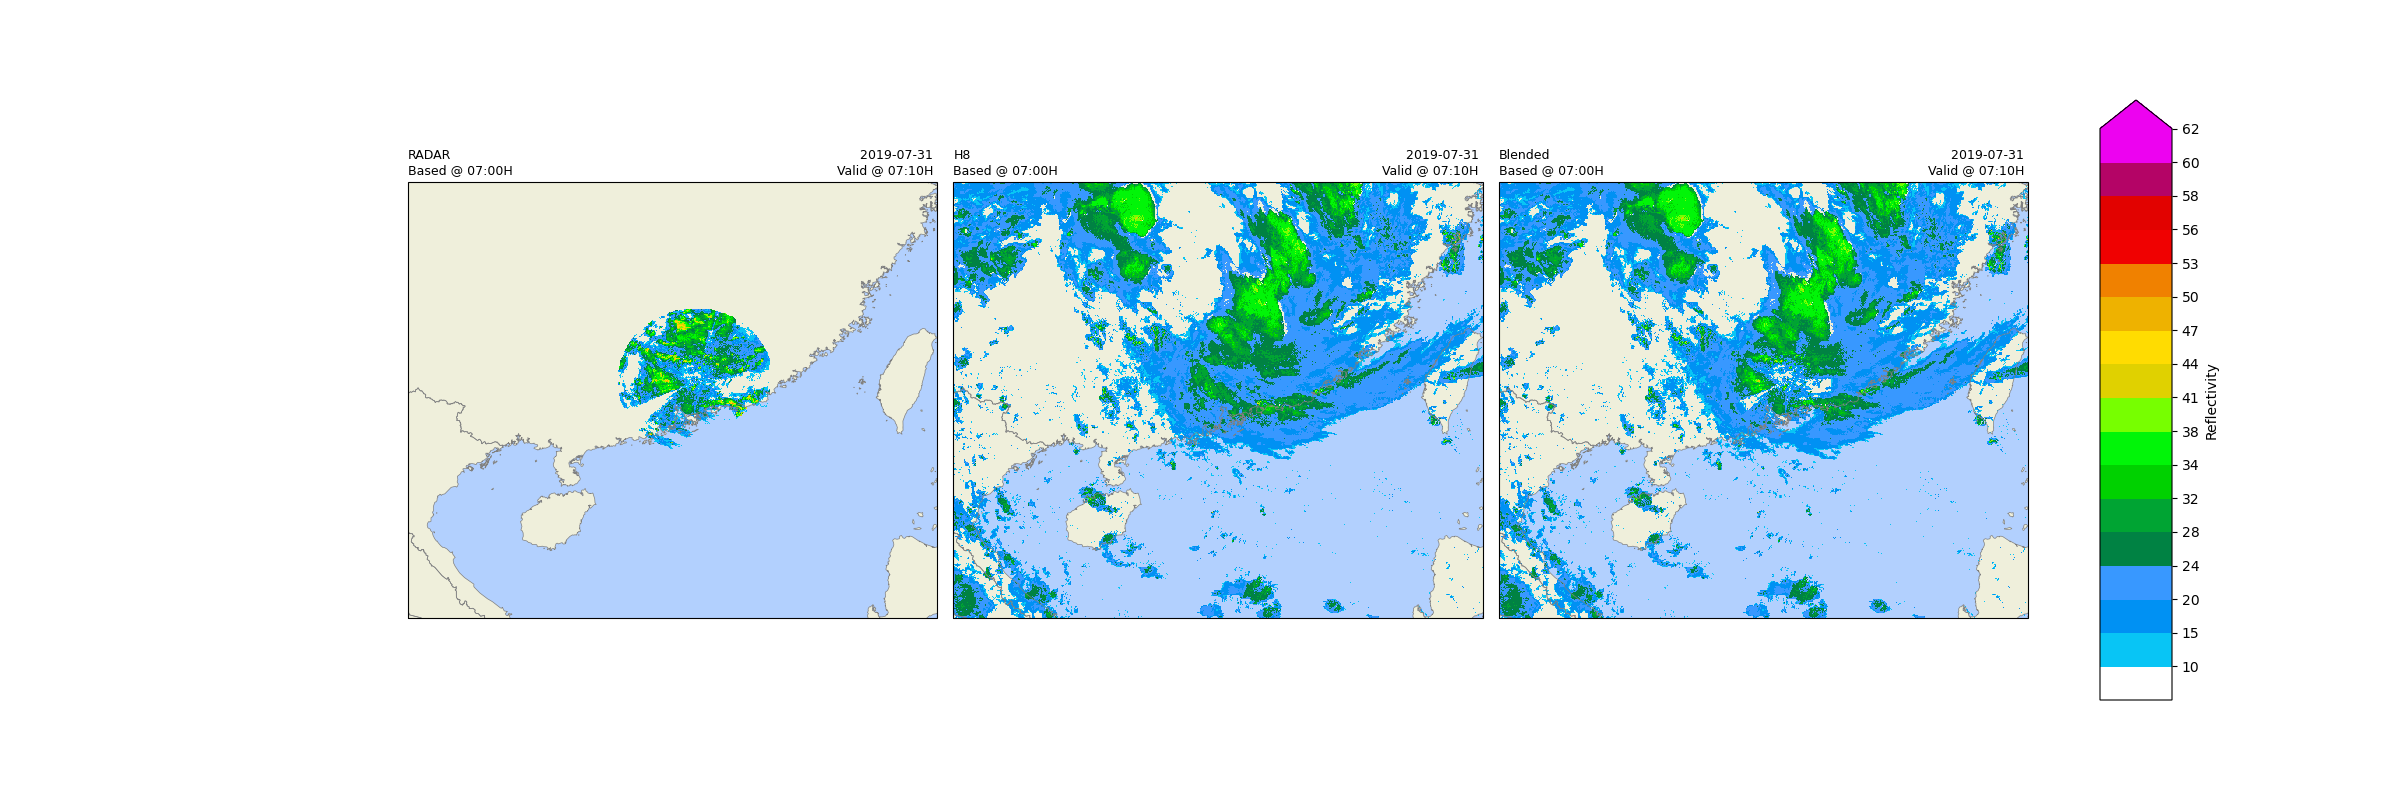
Blending
This example demonstrates how to blend different reflectivity sources into one.
Definitions
import os
import numpy as np
import pandas as pd
import xarray as xr
import matplotlib.pyplot as plt
import cartopy.crs as ccrs
import cartopy.feature as cfeature
import cartopy.io.shapereader as shpreader
from matplotlib.gridspec import GridSpec
from matplotlib.colors import BoundaryNorm
from matplotlib.colors import ListedColormap
from matplotlib.cm import ScalarMappable
from pyresample import utils

from swirlspy.core.resample import grid_resample
from swirlspy.rad.iris import read_iris_grid
from swirlspy.sat.h8 import read_h8_data
from swirlspy.blending import comp_qpe, Raw

plt.switch_backend('agg')

root_dir = os.getcwd()

start_time = pd.Timestamp.now()
Initialising
This section demonstrates parsing Himawari-8 data.
Step 1: Define necessary parameter.
# Define base time
base_time = pd.Timestamp("2019-07-31T07:00")

# Define data boundary in WGS84 (latitude)
latitude_from = 30.
latitude_to = 16.
longitude_from = 105.
longitude_to = 122.

area = (
    latitude_from, latitude_to,
    longitude_from, longitude_to
)

# Define grid size, use negative value for descending range
grid_size = (-.025, .025)

# list of source data
sources = []

initialising_time = pd.Timestamp.now()

# Load map shape
map_shape_file = os.path.abspath(os.path.join(
    root_dir,
    '../tests/samples/shape/se_asia'
))

# coastline and province
map_with_province = cfeature.ShapelyFeature(
    list(shpreader.Reader(map_shape_file).geometries()),
    ccrs.PlateCarree()
)

# define the plot function
def plot_base(ax: plt.Axes, extents: list, crs: ccrs.Projection):
    ax.set_extent(extents, crs=crs)
    # fake the ocean color
    ax.imshow(
        np.tile(np.array([[[178, 208, 254]]], dtype=np.uint8), [2, 2, 1]),
        origin='upper', transform=ccrs.PlateCarree(),
        extent=[-180, 180, -180, 180], zorder=-1
    )
    # coastline, province and state, color
    ax.add_feature(
        map_with_province, facecolor=cfeature.COLORS['land'],
        edgecolor='none', zorder=0
    )
    # overlay coastline, province and state without color
    ax.add_feature(
        map_with_province, facecolor='none', edgecolor='gray', linewidth=0.5
    )
    ax.set_title('')
Step 2: Read data from radar files into xarray.DataArray using read_iris_grid().
radar = read_iris_grid(
    os.path.join(root_dir, "../tests/samples/iris/RAD190731150000.REF2256")
)

radar_time = pd.Timestamp.now()
/opt/conda/envs/swirlspy/lib/python3.6/site-packages/wradlib/io/iris.py:4095: FutureWarning: IRIS Cartesian Product is currently returned with ``origin='upper'``.
From wradlib version 2.0 the images will be returned with ``origin='lower'``.
To silence this warning set kwarg ``origin='upper'`` or ``origin='lower'``.
  filename, loaddata=loaddata, rawdata=rawdata, debug=debug, **kwargs
/tmp/build/docs/swirlspy/swirlspy/rad/_utils.py:55: UserWarning: 'get_area_def' has moved, import it with 'from pyresample import get_area_def'
  area_id, description, proj_id, projection, xres, yres, area_extent
/opt/conda/envs/swirlspy/lib/python3.6/site-packages/pyproj/crs/crs.py:543: UserWarning: You will likely lose important projection information when converting to a PROJ string from another format. See: https://proj.org/faq.html#what-is-the-best-format-for-describing-coordinate-reference-systems
  proj_string = self.to_proj4()
Step 3: Define the target grid as a pyresample AreaDefinition.
# Defining target grid
area_id = "WGS84"
description = 'World Geodetic System 1984'
proj_id = 'WGS84'
projection = '+proj=longlat +datum=WGS84 +no_defs'
x_size = (longitude_to - longitude_from) / grid_size[1] + 1
y_size = (latitude_to - latitude_from) / grid_size[0] + 1
area_extent = (longitude_from, latitude_from, longitude_to, latitude_to)
radar_area_def = utils.get_area_def(
    area_id, description, proj_id, projection, x_size, y_size, area_extent
)
/tmp/build/docs/swirlspy/swirlspy/examples/blend.py:125: UserWarning: 'get_area_def' has moved, import it with 'from pyresample import get_area_def'
  area_id, description, proj_id, projection, x_size, y_size, area_extent
/opt/conda/envs/swirlspy/lib/python3.6/site-packages/pyproj/crs/crs.py:543: UserWarning: You will likely lose important projection information when converting to a PROJ string from another format. See: https://proj.org/faq.html#what-is-the-best-format-for-describing-coordinate-reference-systems
  proj_string = self.to_proj4()
Step 5: Reproject the radar data from read_iris_grid() from Centered Azimuthal (source) projection to World Geodetic System 1984 projection.
# Extracting the AreaDefinition of the source projection
area_def_src = radar.attrs['area_def']

# Reprojecting
reproj_radar = grid_resample(
    radar, area_def_src, radar_area_def,
    coord_label=['x', 'y']
).sortby(
    ['y'], ascending=False
)

# fix floating point issue
y_coords = np.linspace(
    latitude_from,
    latitude_to,
    reproj_radar.data.shape[1],
    dtype=np.float32
)
x_coords = np.linspace(
    longitude_from,
    longitude_to,
    reproj_radar.data.shape[2],
    dtype=np.float32
)
reproj_radar.coords['y'] = np.array(y_coords)
reproj_radar.coords['x'] = np.array(x_coords)
reproj_radar = reproj_radar.sel(time=reproj_radar.coords['time'].values[0])


radar_site = (
    reproj_radar.attrs['proj_site'][1],
    reproj_radar.attrs['proj_site'][0],
    1.8, # radius
    0.76  # weight sigma
)

sources.append(Raw(
    reproj_radar,
    [radar_site],  # sites configuration, list of available sites useful for mosaic data
    0.1  # data weight
))
/opt/conda/envs/swirlspy/lib/python3.6/site-packages/pyresample/image.py:62: FutureWarning: Usage of ImageContainer is deprecated, please use NumpyResamplerBilinear class instead
  FutureWarning)
/opt/conda/envs/swirlspy/lib/python3.6/site-packages/pyproj/crs/crs.py:543: UserWarning: You will likely lose important projection information when converting to a PROJ string from another format. See: https://proj.org/faq.html#what-is-the-best-format-for-describing-coordinate-reference-systems
  proj_string = self.to_proj4()
/opt/conda/envs/swirlspy/lib/python3.6/site-packages/pyresample/image.py:62: FutureWarning: Usage of ImageContainer is deprecated, please use NumpyResamplerBilinear class instead
  FutureWarning)
/opt/conda/envs/swirlspy/lib/python3.6/site-packages/pyproj/crs/crs.py:53: FutureWarning: '+init=<authority>:<code>' syntax is deprecated. '<authority>:<code>' is the preferred initialization method. When making the change, be mindful of axis order changes: https://pyproj4.github.io/pyproj/stable/gotchas.html#axis-order-changes-in-proj-6
  return _prepare_from_string(" ".join(pjargs))
/opt/conda/envs/swirlspy/lib/python3.6/site-packages/pyproj/crs/crs.py:294: FutureWarning: '+init=<authority>:<code>' syntax is deprecated. '<authority>:<code>' is the preferred initialization method. When making the change, be mindful of axis order changes: https://pyproj4.github.io/pyproj/stable/gotchas.html#axis-order-changes-in-proj-6
  projstring = _prepare_from_string(" ".join((projstring, projkwargs)))
/opt/conda/envs/swirlspy/lib/python3.6/site-packages/pyproj/crs/crs.py:543: UserWarning: You will likely lose important projection information when converting to a PROJ string from another format. See: https://proj.org/faq.html#what-is-the-best-format-for-describing-coordinate-reference-systems
  proj_string = self.to_proj4()
Step 6: Define data directory
# Supply data directory.
# Please make sure H8 data filename is follow the naming pattern -
# HS_H08_{date}_{time}_B{channel:02}_FLDK_R{rsol:02}_S{seg:02}10.DAT
# example:
#   base time = 2019-07-31 07:00 UTC
#   channel = 4
#   resolution = 10
#   segment = 2
#   ========================================
#   filename: HS_H08_20190731_0700_B04_FLDK_R10_S0410.DAT
data_dir = os.path.join(root_dir, "../tests/samples/h8")

sat_time = pd.Timestamp.now()
Step 7: Parse data into reflectivity as xarray.DataArray using read_h8_data().
sat = read_h8_data(
    data_dir,
    base_time,
    area,
    grid_size
)
# remove time axis
sat = sat.sel(time=sat.coords['time'].values[0])

# no site data used, treat all points of data with same weight
sources.append(Raw(
    sat,
    weight=0.01  # data weight
))

blend_time = pd.Timestamp.now()
Step 8: Blend all data together.
reflec = comp_qpe(
    grid_size,
    area,
    sources
)


post_time = pd.Timestamp.now()
Step 9: Remove invalid data if needed.
reflec.values[reflec.values < 13.] = reflec.attrs['zero_value']

# update sat data for plotting
sat.values[sat.values < 13.] = sat.attrs['zero_value']
Generating radar reflectivity maps
Define the color scale and format of the plots and plot using xarray.plot().
In this example, only hourly images will be plotted.
# Defining colour scale and format
levels = [
    -32768,
    10, 15, 20, 24, 28, 32,
    34, 38, 41, 44, 47, 50,
    53, 56, 58, 60, 62
]
cmap = ListedColormap([
    '#FFFFFF00', '#08C5F5', '#0091F3', '#3898FF', '#008243', '#00A433',
    '#00D100', '#01F508', '#77FF00', '#E0D100', '#FFDC01', '#EEB200',
    '#F08100', '#F00101', '#E20200', '#B40466', '#ED02F0'
])

norm = BoundaryNorm(levels, ncolors=cmap.N, clip=True)

# colorbar map
mappable = ScalarMappable(cmap=cmap, norm=norm)
mappable.set_array([])

# Defining the crs
crs = ccrs.PlateCarree()
extents = (longitude_from, longitude_to, latitude_from, latitude_to)

# Plotting
fig: plt.Figure = plt.figure(figsize=(24, 8), frameon=False)
gs = GridSpec(
    1, 3, figure=fig, wspace=0.03, hspace=-0.25, top=0.95,
    bottom=0.05, left=0.17, right=0.845
)

# plot radar
ax = fig.add_subplot(gs[0, 0], projection=crs)

plot_base(ax, extents, crs)

im = ax.imshow(reproj_radar.values, cmap=cmap, norm=norm, interpolation='nearest',
               extent=extents)

ax.set_title(
    "RADAR\n"
    f"Based @ {base_time.strftime('%H:%MH')}",
    loc='left',
    fontsize=9
)
ax.set_title(
    ''
)
ax.set_title(
    f"{base_time.strftime('%Y-%m-%d')} \n"
    f"Valid @ {(base_time + pd.Timedelta(minutes=10)).strftime('%H:%MH')} ",
    loc='right',
    fontsize=9
)

# plot H8
ax = fig.add_subplot(gs[0, 1], projection=crs)

plot_base(ax, extents, crs)

im = ax.imshow(sat.values, cmap=cmap, norm=norm, interpolation='nearest',
               extent=extents)

ax.set_title(
    "H8\n"
    f"Based @ {base_time.strftime('%H:%MH')}",
    loc='left',
    fontsize=9
)
ax.set_title(
    ''
)
ax.set_title(
    f"{base_time.strftime('%Y-%m-%d')} \n"
    f"Valid @ {(base_time + pd.Timedelta(minutes=10)).strftime('%H:%MH')} ",
    loc='right',
    fontsize=9
)

# plot blended
ax = fig.add_subplot(gs[0, 2], projection=crs)

plot_base(ax, extents, crs)

im = ax.imshow(reflec.values, cmap=cmap, norm=norm, interpolation='nearest',
               extent=extents)

ax.set_title(
    "Blended\n"
    f"Based @ {base_time.strftime('%H:%MH')}",
    loc='left',
    fontsize=9
)
ax.set_title(
    ''
)
ax.set_title(
    f"{base_time.strftime('%Y-%m-%d')} \n"
    f"Valid @ {(base_time + pd.Timedelta(minutes=10)).strftime('%H:%MH')} ",
    loc='right',
    fontsize=9
)

cbar_ax = fig.add_axes([0.875, 0.125, 0.03, 0.75])
cbar = fig.colorbar(
    mappable, cax=cbar_ax, ticks=levels[1:], extend='max', format='%.3g')
cbar.ax.set_ylabel('Reflectivity', rotation=90)

fig.savefig(
    os.path.join(
        root_dir,
        "../tests/outputs/blending.png"
    ),
    bbox_inches='tight'
)

image_time = pd.Timestamp.now()
Checking run time of each component
print(f"Start time: {start_time}")
print(f"Initialising time: {initialising_time}")
print(f"Read radar time: {radar_time}")
print(f"Parse H8 data time: {sat_time}")
print(f"Blending time: {blend_time}")
print(f"Post blending time: {post_time}")
print(f"Plotting blended image time: {image_time}")

print(f"Time to initialise: {initialising_time - start_time}")
print(f"Time to run read radar: {radar_time - initialising_time}")
print(f"Time to run data parsing: {sat_time - radar_time}")
print(f"Time to run blending: {blend_time - sat_time}")
print(f"Time to perform post process: {post_time - blend_time}")
print(f"Time to plot reflectivity image: {image_time - post_time}")
Start time: 2024-04-22 05:44:19.394238
Initialising time: 2024-04-22 05:44:19.395679
Read radar time: 2024-04-22 05:44:19.727972
Parse H8 data time: 2024-04-22 05:44:20.420444
Blending time: 2024-04-22 05:44:27.587228
Post blending time: 2024-04-22 05:44:27.789311
Plotting blended image time: 2024-04-22 05:44:30.439142
Time to initialise: 0 days 00:00:00.001441
Time to run read radar: 0 days 00:00:00.332293
Time to run data parsing: 0 days 00:00:00.692472
Time to run blending: 0 days 00:00:07.166784
Time to perform post process: 0 days 00:00:00.202083
Time to plot reflectivity image: 0 days 00:00:02.649831
Total running time of the script: ( 0 minutes 11.618 seconds)