Note
Click here to download the full example code
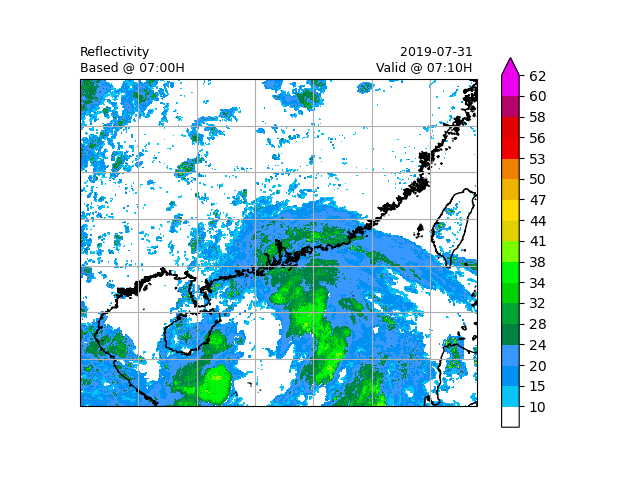
Himawari-8 data
This example demonstrates how to read Himawari-8 data files as reflectivity data.
Definitions
import os
import numpy as np
import pandas as pd
import xarray as xr
import cartopy as ct
import cartopy.feature as cfeature
import matplotlib.pyplot as plt
from matplotlib.colors import BoundaryNorm, ListedColormap

from swirlspy.sat.h8 import read_h8_data

plt.switch_backend('agg')

root_dir = os.getcwd()

start_time = pd.Timestamp.now()
Initialising
This section demonstrates parsing Himawari-8 data.
Step 1: Define necessary parameter.
# Define base time
base_time = pd.Timestamp("2019-07-31T07:00")

# Define data boundary in WGS84 (latitude)
latitude_from = 30.
latitude_to = 16.
longitude_from = 105.
longitude_to = 122.

area = (
    latitude_from, latitude_to,
    longitude_from, longitude_to
)

# Define grid size, use negative value for descending range
grid_size = (-.025, .025)
Step 2: Define data directory
# Supply data directory.
# Please make sure H8 data filename is follow the naming pattern -
# HS_H08_{date}_{time}_B{channel:02}_FLDK_R{rsol:02}_S{seg:02}10.DAT
# example:
#   base time = 2019-07-31 07:00 UTC
#   channel = 4
#   resolution = 10
#   segment = 2
#   ========================================
#   filename: HS_H08_20190731_0700_B04_FLDK_R10_S0410.DAT
data_dir = os.path.join(root_dir, "../tests/samples/h8")

initialising_time = pd.Timestamp.now()
Step 3: Parse data into reflectivity as xarray.DataArray using read_h8_data().
reflec = read_h8_data(
    data_dir,
    base_time,
    area,
    grid_size
)

sat_time = pd.Timestamp.now()
Step 4: Remove invalid data if needed. **those data may be useful during post process, so this step is optional.
reflec.values[reflec.values < 13.] = reflec.attrs['zero_value']

sat_post_time = pd.Timestamp.now()
Generating radar reflectivity maps
Define the color scale and format of the plots and plot using xarray.plot().
In this example, only hourly images will be plotted.
# Defining colour scale and format
levels = [
    -32768,
    10, 15, 20, 24, 28, 32,
    34, 38, 41, 44, 47, 50,
    53, 56, 58, 60, 62
]
cmap = ListedColormap([
    '#FFFFFF', '#08C5F5', '#0091F3', '#3898FF', '#008243', '#00A433',
    '#00D100', '#01F508', '#77FF00', '#E0D100', '#FFDC01', '#EEB200',
    '#F08100', '#F00101', '#E20200', '#B40466', '#ED02F0'
])

norm = BoundaryNorm(levels, ncolors=cmap.N, clip=True)

# Defining the crs
crs = ct.crs.PlateCarree()

# Defining coastlines
hires = cfeature.GSHHSFeature(
    levels=[1],
    scale='h',
    edgecolor='k'
)


# Plotting
f = plt.figure()
ax = plt.axes(projection=crs)
ax.set_extent((
    longitude_from, longitude_to,
    latitude_from, latitude_to
), crs=crs)

ax.add_feature(hires)  # coastlines
ax.gridlines()

reflec.where(reflec != reflec.attrs['zero_value']).plot(
    ax=ax,
    cbar_kwargs={
        'extend': 'max',
        'ticks': levels[1:],
        'format': '%.3g'
    },
    cmap=cmap,
    norm=norm
)
ax.set_title(
    "Reflectivity\n"
    f"Based @ {base_time.strftime('%H:%MH')}",
    loc='left',
    fontsize=9
)
ax.set_title(
    ''
)
ax.set_title(
    f"{base_time.strftime('%Y-%m-%d')} \n"
    f"Valid @ {(base_time + pd.Timedelta(minutes=10)).strftime('%H:%MH')} ",
    loc='right',
    fontsize=9
)

plt.savefig(
    root_dir +
    f"/../tests/outputs/h8.png",
    dpi=300
)

sat_image_time = pd.Timestamp.now()
/opt/conda/envs/swirlspy/lib/python3.6/site-packages/cartopy/io/__init__.py:241: DownloadWarning: Downloading: https://www.ngdc.noaa.gov/mgg/shorelines/data/gshhs/oldversions/version2.2.0/GSHHS_shp_2.2.0.zip
  warnings.warn('Downloading: {}'.format(url), DownloadWarning)
/opt/conda/envs/swirlspy/lib/python3.6/site-packages/shapefile.py:391: UserWarning: Shapefile shape has invalid polygon: no exterior rings found (must have clockwise orientation); interpreting holes as exteriors.
  warnings.warn('Shapefile shape has invalid polygon: no exterior rings found (must have clockwise orientation); interpreting holes as exteriors.')
Checking run time of each component
print(f"Start time: {start_time}")
print(f"Initialising time: {initialising_time}")
print(f"H8 data parsing time: {sat_time}")
print(f"Post H8 data processing time: {sat_post_time}")
print(f"Plotting sat image time: {sat_image_time}")

print(f"Time to initialise: {initialising_time - start_time}")
print(f"Time to run data parsing: {sat_time - initialising_time}")
print(f"Time to perform post process: {sat_post_time - sat_time}")
print(f"Time to plot reflectivity image: {sat_image_time - sat_post_time}")
Start time: 2024-04-22 05:25:29.986202
Initialising time: 2024-04-22 05:25:29.987223
H8 data parsing time: 2024-04-22 05:25:37.642084
Post H8 data processing time: 2024-04-22 05:25:37.643860
Plotting sat image time: 2024-04-22 05:27:05.676932
Time to initialise: 0 days 00:00:00.001021
Time to run data parsing: 0 days 00:00:07.654861
Time to perform post process: 0 days 00:00:00.001776
Time to plot reflectivity image: 0 days 00:01:28.033072
Total running time of the script: ( 1 minutes 36.647 seconds)