Note
Click here to download the full example code
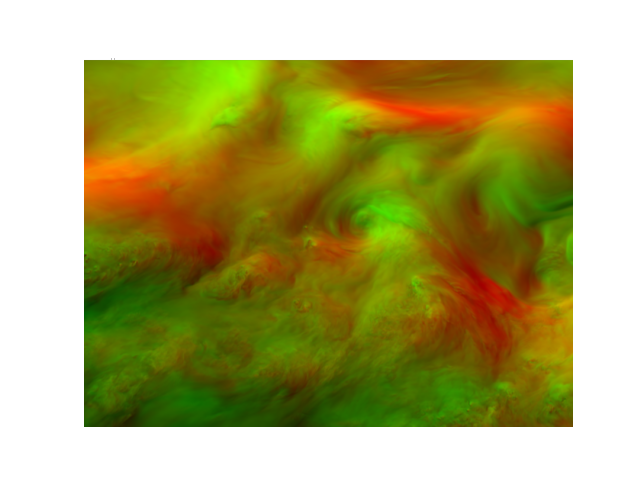
Convert to RGB format (vector data)
This example demonstrates convertion from wind data to uv rgb format (with HKO earth format).
Definitions
Import all required modules and methods:
# Python package to allow system command line functions
import os
# Python package to manage warning message
import warnings
# Python package for time calculations
import pandas as pd
# Python package for numerical calculations
import numpy as np
# Python package for xarrays to read and handle netcdf data
import xarray as xr
# Python package for image generation
from PIL import Image
# Python package for image preview
import matplotlib.pyplot as plt

# swirlspy data convertion function
from swirlspy.utils.conversion import to_rgb_data, to_hko_earth_format
# directory constants
from swirlspy.tests.samples import DATA_DIR
from swirlspy.tests.outputs import OUTPUT_DIR

warnings.filterwarnings("ignore")
Define the working directories:
data_dir = os.path.join(DATA_DIR, 'gts')

# Logging
start_time = pd.Timestamp.now()
Loading wind data
# Specify the basetime
basetime = pd.Timestamp('202107180000')

# Reading the wind data
ds = xr.open_dataset(
    os.path.join(
        data_dir,
        f"romas_plv_{basetime.strftime('%Y%m%d%H%M')}.nc"
    )
)

# pick pressure level, e.g. 200 in this case
ds_200 = ds.sel(isobaricInhPa=200)
u = ds_200['u'].data
v = ds_200['v'].data
y = ds['latitude'].data
x = ds['longitude'].data

# Close dataset
ds.close()

initialising_time = pd.Timestamp.now()
Extract all necessary values for rgb image
# prepare placeholder for necessary values
d = np.empty((len(y), len(x), 2))

d[:] = 0
d[:, :, 0] = u
d[:, :, 1] = v

# calculate x, y step size
y_step = (y[-1] - y[0]) / len(y)
x_step = (x[-1] - x[0]) / len(x)

# build image data
data = xr.DataArray(
    d,
    dims=['y', 'x', 'wind'],
    coords={
        'wind': ['u', 'v'],
        'y': y,
        'x': x
    },
    attrs={
        'y_step': y_step,
        'x_step': x_step
    }
)

preparation_time = pd.Timestamp.now()
Convert image data into rgb format
# this step is not necessary, depends on any meta data and preprocess is required by your platform
earth_data = to_hko_earth_format(data, coords_dp=3, values_dp=0, uv_mode=True, y_step=y_step, x_step=x_step)
rgb = to_rgb_data(earth_data, uv_mode=True)

convertion_time = pd.Timestamp.now()
Visualisation
path = os.path.join(OUTPUT_DIR, "rgb_wind.png")
with Image.fromarray(rgb, 'RGBA') as img:
    img.save(path, 'png')

# preview
with Image.open(path) as image:
    plt.axis('off')
    plt.imshow(image)
    plt.plot()
    plt.show()

visualise_time = pd.Timestamp.now()
Checking run time of each component
print(f"Start time: {start_time}")
print(f"Initialising time: {initialising_time}")
print(f"Preparation time: {preparation_time}")
print(f"Convertion time: {convertion_time}")
print(f"Visualise time: {visualise_time}")

print(f"Time to initialise: {initialising_time - start_time}")
print(f"Time to prepare information: {preparation_time - initialising_time}")
print(f"Time to convertion: {convertion_time - preparation_time}")
print(f"Time to visualise: {visualise_time - convertion_time}")

print(f"Total: {visualise_time - start_time}")
Start time: 2026-04-20 22:24:10.585132
Initialising time: 2026-04-20 22:24:16.090680
Preparation time: 2026-04-20 22:24:16.093780
Convertion time: 2026-04-20 22:24:16.126289
Visualise time: 2026-04-20 22:24:16.303710
Time to initialise: 0 days 00:00:05.505548
Time to prepare information: 0 days 00:00:00.003100
Time to convertion: 0 days 00:00:00.032509
Time to visualise: 0 days 00:00:00.177421
Total: 0 days 00:00:05.718578
Total running time of the script: ( 0 minutes 5.838 seconds)