Note
Click here to download the full example code
QPE (Hong Kong)
This example demonstrates how to perform QPE, using raingauge and radar data from Hong Kong.
Definitions
Import all required modules and methods:
# Python package to allow system command line functions
import os
# Python package to manage warning message
import warnings
# Python package for time calculations
import pandas as pd
# Python package for numerical calculations
import numpy as np
# Python package for xarrays to read and handle netcdf data
import xarray as xr
# Python package for projection description
import pyproj
from pyresample import get_area_def
from sklearn.gaussian_process import kernels
# Python package for reading map shape file
import cartopy.io.shapereader as shpreader
# Python package for creating plots
from matplotlib import pyplot as plt
# Python package for colorbars
from matplotlib.colors import BoundaryNorm, ListedColormap

# swirlspy regrid function
from swirlspy.core.resample import grid_resample
# swirlspy raingauge data object
from swirlspy.obs import Rain
# swirlspy iris parser function
from swirlspy.rad.iris import read_iris_grid
# swirlspy raingauge data interpolate and blending
from swirlspy.qpe.rfmap import rg_interpolate, comp_qpe
# swirlspy test data source locat utils function
from swirlspy.qpe.utils import timestamps_ending, locate_file
# swirlspy standardize data function
from swirlspy.utils import FrameType, standardize_attr, conversion
# directory constants
from swirlspy.tests.samples import DATA_DIR
from swirlspy.tests.outputs import OUTPUT_DIR

warnings.filterwarnings("ignore")
plt.switch_backend('agg')
Initialising
This section demonstrates extracting raingauge and radar data.
Step 1: Defining an end-time for accumulating rainfall.
acctime = pd.Timestamp('20190420150000').floor('min')
acctime_str = acctime.strftime('%Y%m%d%H%M')
Step 2: Setting up directories for raingauge and radar files.
rad_dir = os.path.join(DATA_DIR, 'iris')
rg_dir = os.path.join(DATA_DIR, 'rfmap')
Step 3: Generating timestamps and pattern for both radar and raingauge files.
# Timestamps of raingauges
rg_timestrings = timestamps_ending(
    acctime + pd.Timedelta(minutes=5),
    duration=pd.Timedelta(hours=1),
    interval=pd.Timedelta(minutes=5)
)

# Raingauge pattern
rg_pattern = ['rf5m_20'+ts for ts in rg_timestrings]

# Finding time nearest radar file
# to accumulation end time
minute = acctime.minute
nearest_6min = acctime.minute // 6 * 6

nearest_rad_timestamp = pd.Timestamp(
    acctime_str[:-2]+f'{nearest_6min:02}'
)

rad_timestrings = timestamps_ending(
    nearest_rad_timestamp,
    duration=pd.Timedelta(hours=1),
    interval=pd.Timedelta(minutes=6)
)
Step 4: Extracting raingauge and radar files from their respective directories.
located_rg_files = []
for pat in rg_pattern:
    located_rg_files.append(locate_file(rg_dir, pat))

located_radar_files = []
for ts in rad_timestrings:
    located_radar_files.append(locate_file(rad_dir, ts))
Step 5: Read data from raingauge files into a Rain object. Coordinates are geodetic, following that in the files. There is some noise in the raingauge, so known problematic stations are filtered away.
rg_object_geodetic = Rain(
    located_rg_files,
    'geodetic',
    duration=pd.Timedelta(minutes=5),
    NAN=[3276.7, 32767]
)

bad_stations = ['N25', 'SSP', 'D25', 'TWN', 'TMS', 'N14']
rg_object_geodetic = rg_object_geodetic.remove_bad_stations(
    bad_stations
)
Step 6: Read radar files into xarray.DataArrays. The data in the files are already in Cartesian Coordinates, in the Centered Azimuthal Projection.
reflec_list = []
for file in located_radar_files:
    reflec = read_iris_grid(
        file
    )

    reflec_list.append(reflec)
Data Reprojection
This section demonstrates the reprojection of extracted raingauge and radar data to a user-defined grid.
Step 1: Define the target grid as a pyresample AreaDefinition.
# Defining target grid
area_id = "hk1980_grid"
description = ("A grid centered about Hong Kong with a resolution "
               "880m in the x-direction and 660m in the y-direction "
               "HK1980 easting/northing coordinates")
proj_id = 'hk1980'
projection = ('+proj=tmerc +lat_0=22.31213333333334 '
              '+lon_0=114.1785555555556 +k=1 +x_0=836694.05 '
              '+y_0=819069.8 +ellps=intl +towgs84=-162.619,-276.959,'
              '-161.764,0.067753,-2.24365,-1.15883,-1.09425 +units=m '
              '+no_defs')

x_size = 1000
y_size = 1000

area_extent = (792000, 796000, 880000, 862000)

area_def = get_area_def(
    area_id, description, proj_id, projection, x_size, y_size, area_extent
)
Step 2: Convert coordinates of raingauge object to desired projection. In this example, the desired projection is HK1980. This can be achieved by the .reproject() method of the Rain object.
inProj = pyproj.Proj(init="epsg:4326")
outProj = pyproj.Proj(area_def.proj_str)

rg_object = rg_object_geodetic.reproject(inProj, outProj, "HK1980")
Step 3: Regrid radar reflectivity from Centered Azimuthal Projection to HK1980.
reproj_reflec_list = []
for reflec in reflec_list:
    reproj_reflec = grid_resample(
        reflec,
        reflec.attrs['area_def'],
        area_def, coord_label=['easting', 'northing']
    )
    reproj_reflec_list.append(reproj_reflec)

reflectivity = xr.concat(reproj_reflec_list, dim='time')
standardize_attr(reflectivity, frame_type=FrameType.dBZ)
Accumulating and interpolating rainfall
Interpolate rainfall recorded by raingauges into the user-defined grid and accumulate radar rainfall over an hour after making the necessary adjustments.
Step 1: Interpolate Rain object to user-defined grid. In this example, ordinary kriging is used.
Using kriging may require further customisation of certain parameters.
# Perform some primitive quality control
upperQ = np.quantile(rg_object.rainfall, .75)
lowerQ = np.quantile(rg_object.rainfall, .25)
iqr = upperQ - lowerQ

noisePos = np.logical_or(rg_object.rainfall > upperQ + 1.5*iqr,
                         rg_object.rainfall < lowerQ - 1.5*iqr)

alpha = np.where(noisePos, 1e4, 1e-10)

kernel = kernels.Matern()

interpolated_rg = rg_interpolate(
    rg_object, area_def, 'ordinary_kriging',
    coord_label=['easting', 'northing'],
    kernel=kernel,
    alpha=alpha,
    n_restarts_optimizer=20
)
Step 2: Convert to radar reflectivity to rainrates, interpolate rainrates to times of raingauges, and convert to rainfalls accumulated every 5 minutes.
rainrates = conversion.to_rainfall_rate(reflectivity, False, a=58.53, b=1.56)

# Convert time coordinates of rainrates from start time
# to end time
rainrates_time_endtime = rainrates.copy()
rainrates_time_endtime.coords['time'] = \
    [
        pd.Timestamp(t) + pd.Timedelta(minutes=6)
        for t in rainrates.coords['time'].values
]

rainrates_5min = conversion.temporal_interpolate(
    rainrates_time_endtime,
    rg_object.start_time + pd.Timedelta(minutes=5),
    rg_object.end_time,
    result_step_size=pd.Timedelta(minutes=5),
    interp_type='quadratic'
)
standardize_attr(rainrates_5min, frame_type=FrameType.mmph)
rainfalls = conversion.to_rainfall_depth(rainrates_5min)
Step 3: Accumulate rainfall over an hour.
# only last frame are required in this case
acc_rf = conversion.acc_rainfall_depth(
    rainfalls,
    rg_object.end_time,
    rg_object.end_time,
    pd.Timedelta(minutes=60)
)
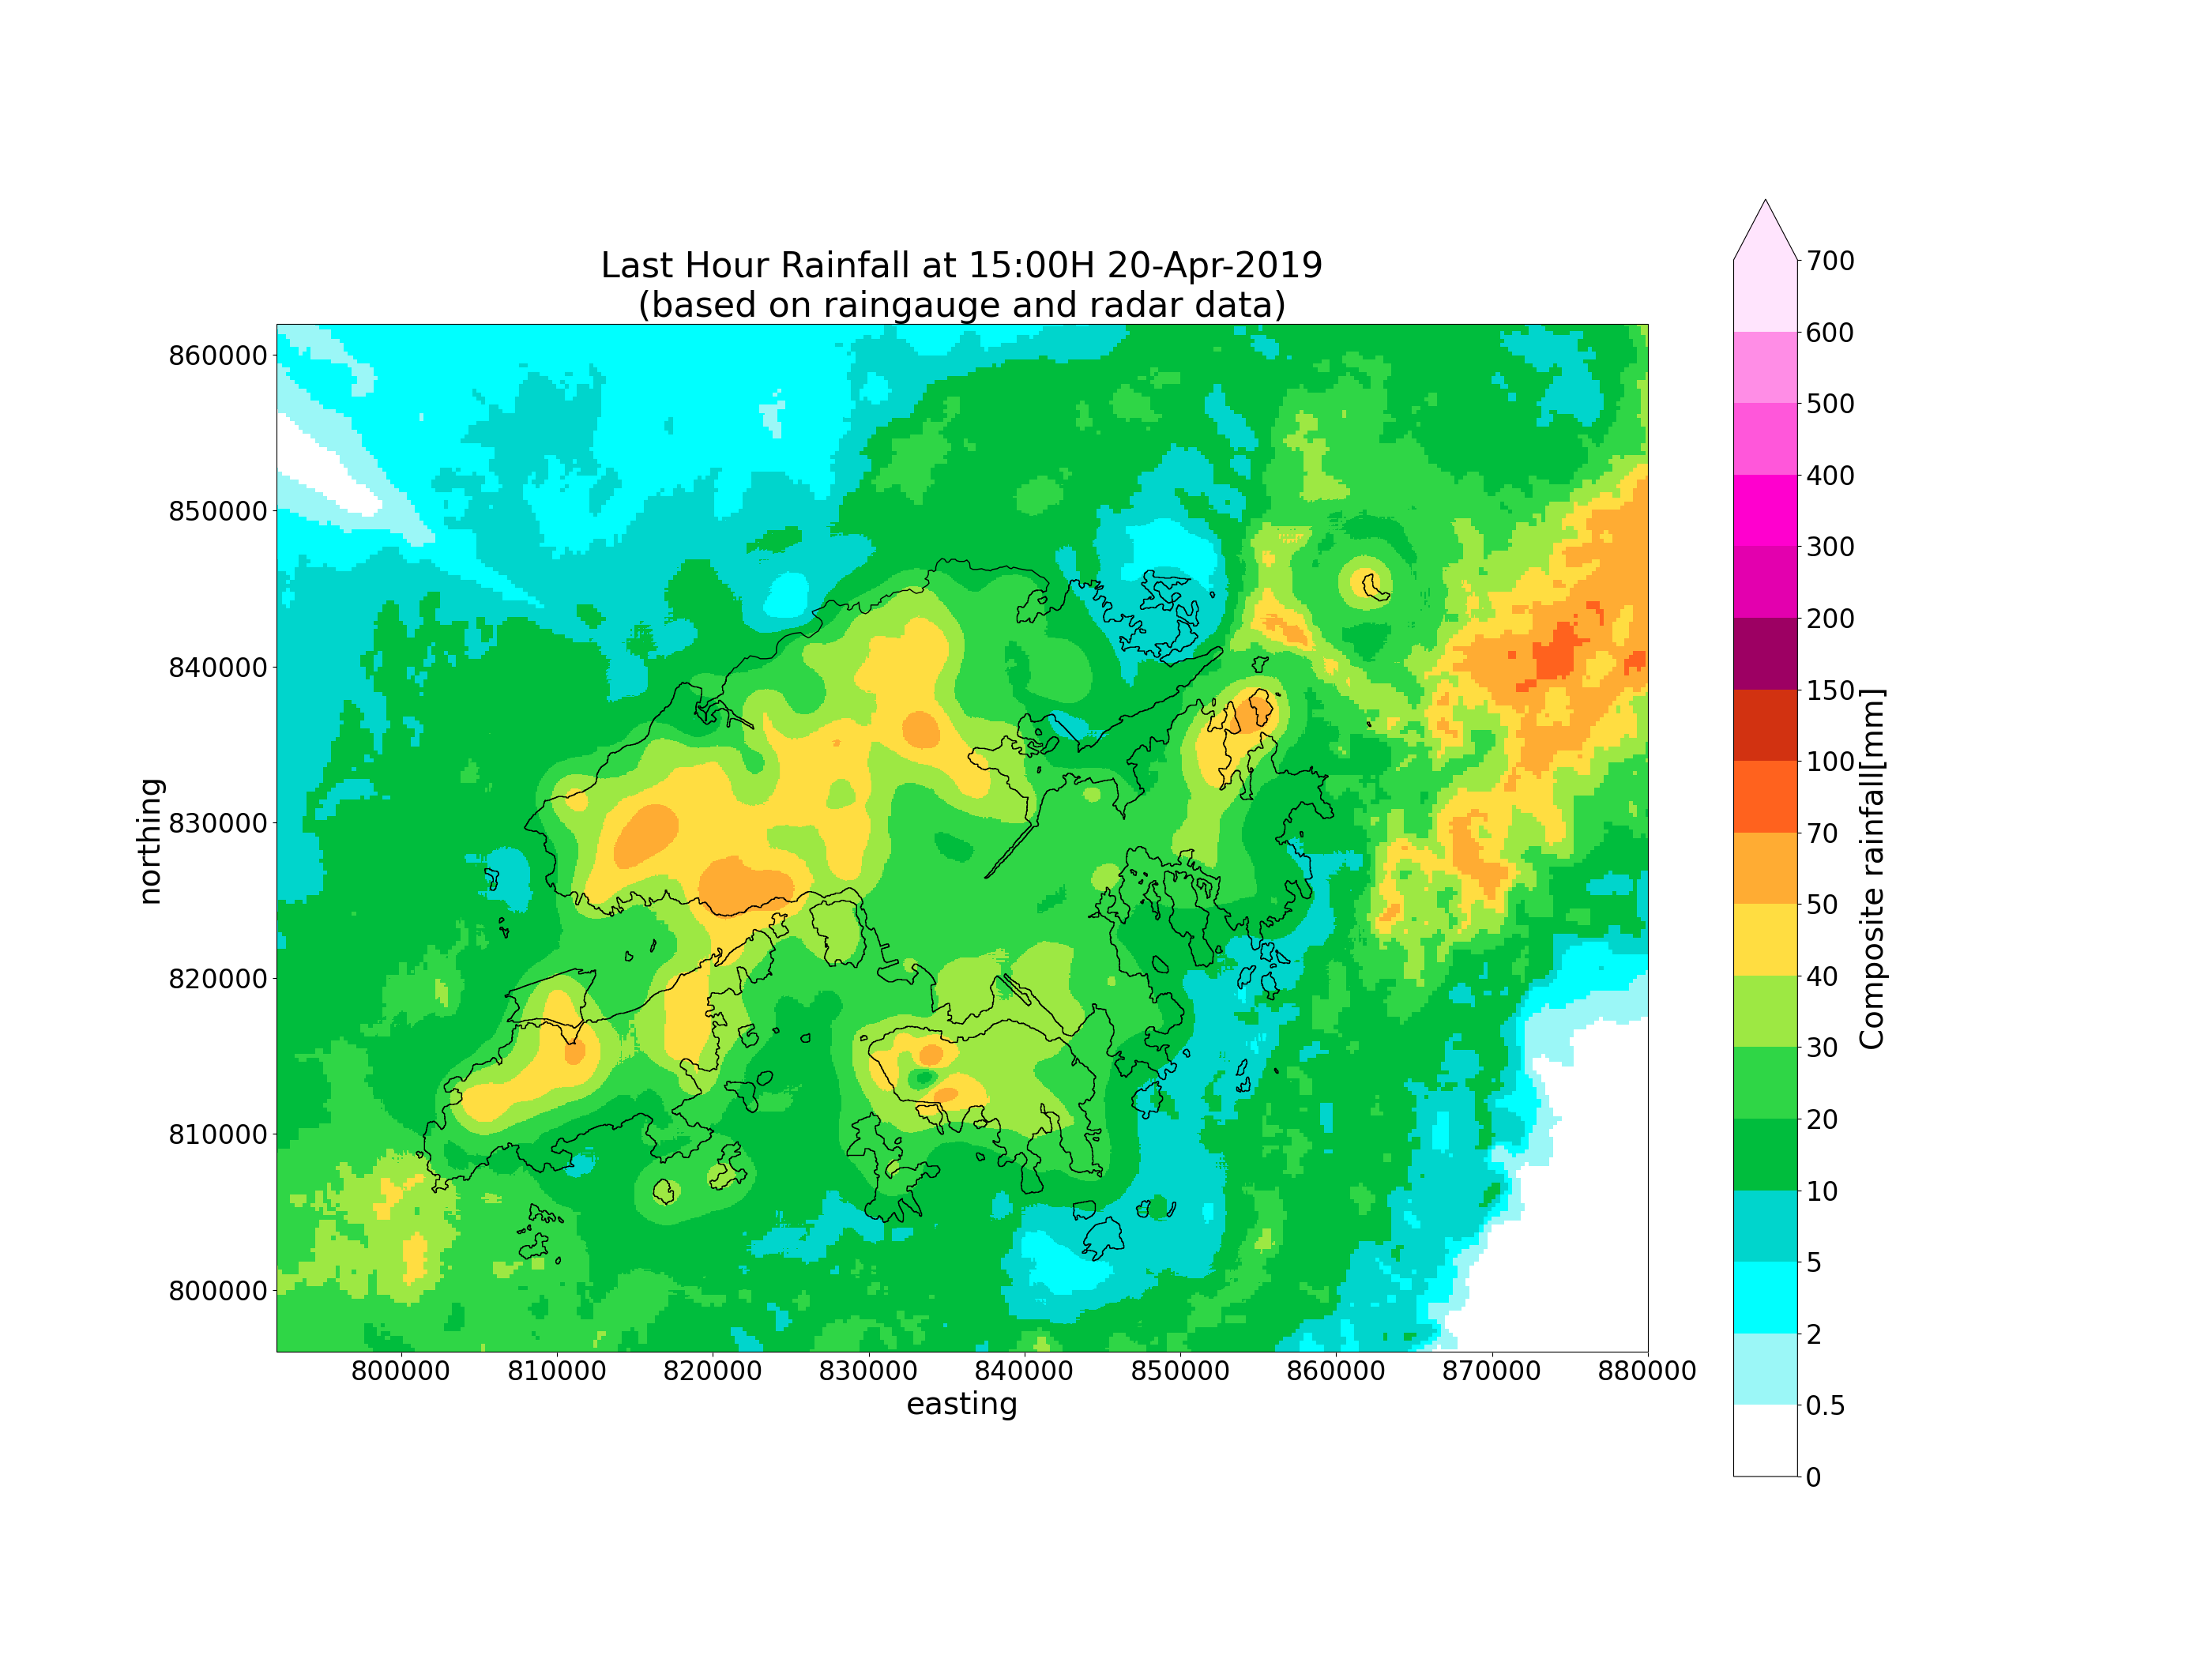
Compositing rainfall
Perform compositing on radar and raingauge derived rainfall to obtain a composite QPE.
Some parameter tuning may be required to make the observations fit better with each other.
comprf = comp_qpe(
    area_def,
    rg_object=rg_object,
    rg_interp=interpolated_rg,
    rad_rf=acc_rf,
    rg_radius=5000,
    max_truth={'rg': 1., 'radar': 0.1}
)
Plotting
Plot composited radar and raingauge rainfall.
# Plotting function for neatness.


def plot_map(
    da, rg_object, acctime, area_def,
    based='raingauge and radar',
    savepath='',
):
    """
    A custom function for plotting a map.

    Parameters
    --------------
    da: xarray.DataArray
        Contains data to be plotted.
    rg_object: Rain
        Contains raingauge data.
    acctime: pd.Timestamp
        Contains the endtime of the accumulation
        period.
    area_def: pyresample.geometry.AreaDefinition
        AreaDefinition of the grid.
    based: str
        Type of data plotted in the map.
    savepath: str
        Path to save the image to.

    """
    # Defining the colour scheme
    levels = [
        0, 0.5, 2, 5, 10, 20,
        30, 40, 50, 70, 100, 150,
        200, 300, 400, 500, 600, 700
    ]

    cmap = ListedColormap([
        '#ffffff', '#9bf7f7', '#00ffff', '#00d5cc', '#00bd3d', '#2fd646',
        '#9de843', '#ffdd41', '#ffac33', '#ff621e', '#d23211', '#9d0063',
        '#e300ae', '#ff00ce', '#ff57da', '#ff8de6', '#ffe4fd'
    ])

    norm = BoundaryNorm(levels, ncolors=cmap.N, clip=True)

    # Plotting axes
    plt.figure(figsize=(28, 21))
    crs = area_def.to_cartopy_crs()
    ax = plt.axes(projection=crs)

    # Plot data
    quadmesh = da.plot(
        cmap=cmap,
        norm=norm,
        extend='max',
        cbar_kwargs={'ticks': levels, 'format': '%.3g'}
    )

    # Adjusting size of colorbar
    cb = quadmesh.colorbar
    cb.ax.set_ylabel(
        da.attrs['long_name']+'['+da.attrs['units']+']',
        fontsize=28
    )

    cb.ax.tick_params(labelsize=24)

    # Setting labels
    ax.xaxis.set_visible(True)
    ax.yaxis.set_visible(True)

    try:
        for tick in ax.xaxis.get_major_ticks():
            tick.label.set_fontsize(24)
    except AttributeError:
        for label in ax.xaxis.get_ticklabels():
            label.set_fontsize(24)

    try:
        for tick in ax.yaxis.get_major_ticks():
            tick.label.set_fontsize(24)
    except AttributeError:
        for label in ax.yaxis.get_ticklabels():
            label.set_fontsize(24)

    ax.xaxis.label.set_size(28)
    ax.yaxis.label.set_size(28)

    # Coastlines
    shp = shpreader.Reader(os.path.join(
        DATA_DIR, 'gadm36_HKG_shp/gadm36_HKG_0_hk1980'))
    for _, geometry in zip(shp.records(), shp.geometries()):
        ax.add_geometries([geometry], crs, facecolor='None', edgecolor='black')

    # Show title
    plt.title(
        (f"Last Hour Rainfall at {acctime.strftime('%H:%MH %d-%b-%Y')}\n"
         f"(based on {based} data)"),
        fontsize=32
    )

    plt.savefig(savepath, dpi=300)
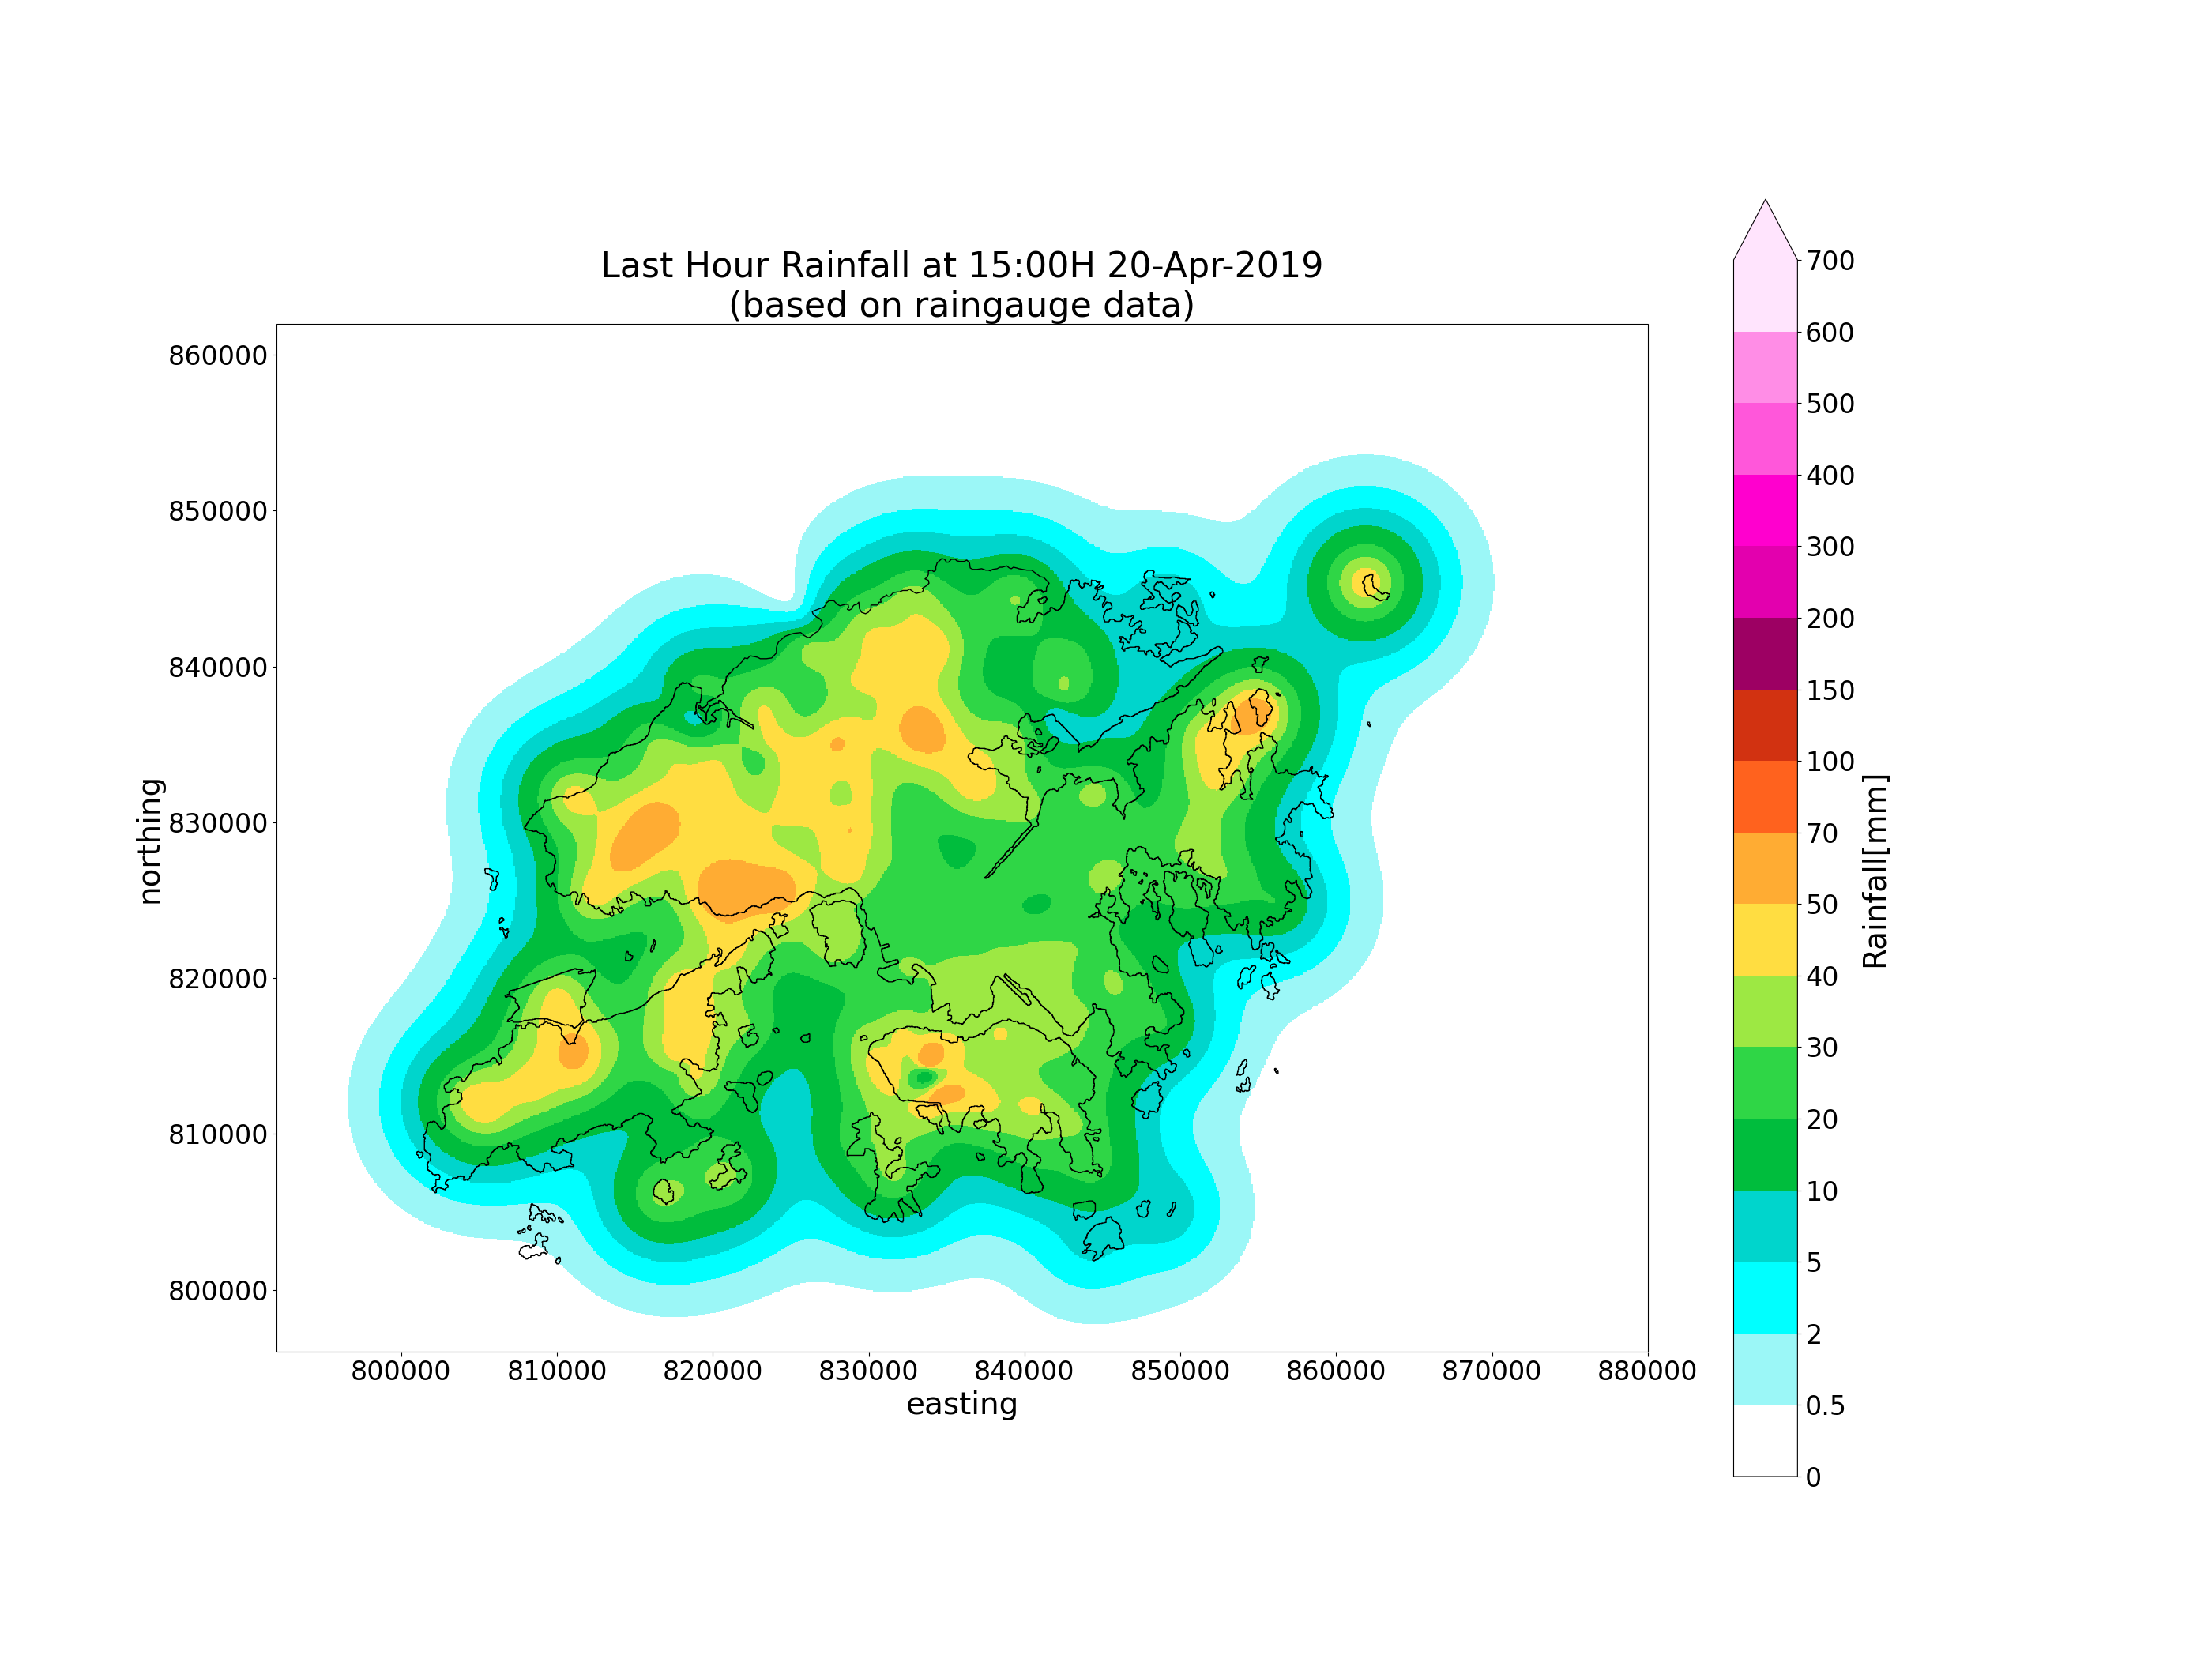
# Plotting maps
# Raingauge only
plot_map(
interpolated_rg, rg_object,
acctime, area_def,
based='raingauge',
savepath=os.path.join(OUTPUT_DIR, f'raingauge_{acctime_str}.png')
)
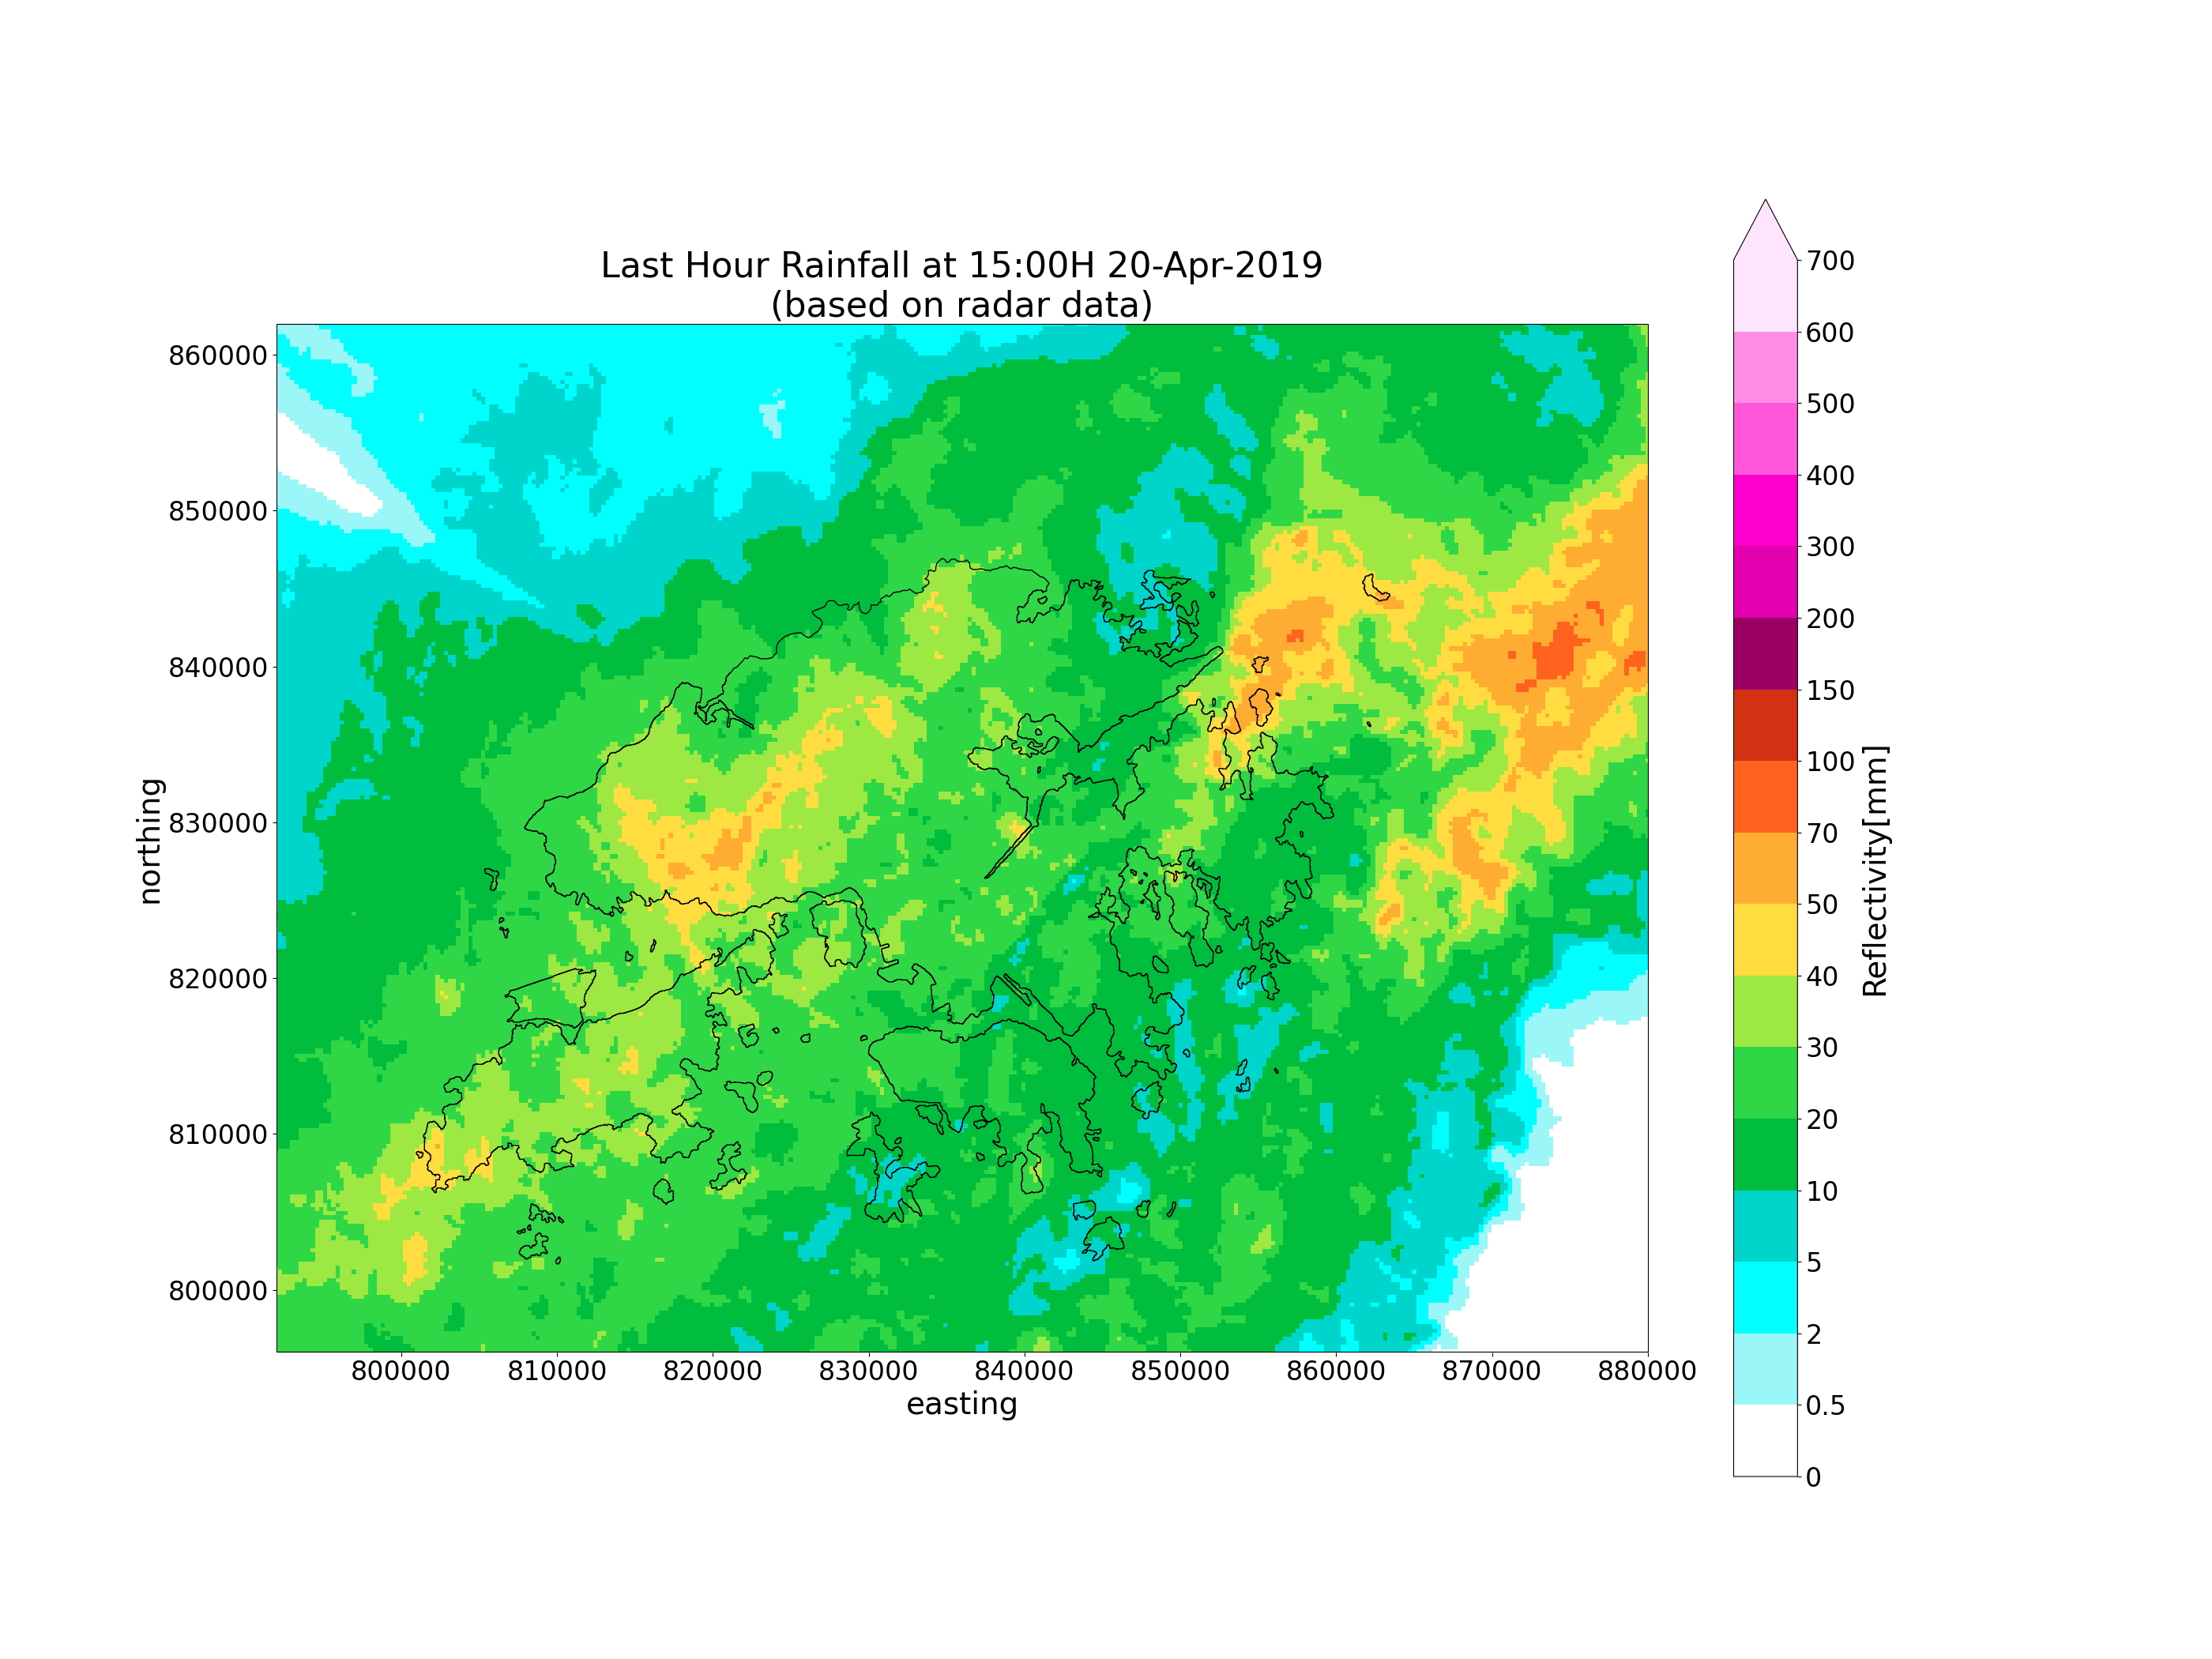
# Radar only
plot_map(
acc_rf, rg_object,
acctime, area_def,
based='radar',
savepath=os.path.join(OUTPUT_DIR, f'radar_{acctime_str}.png')
)
# Composite raingauge and radar
plot_map(
comprf, rg_object,
acctime, area_def,
savepath=os.path.join(OUTPUT_DIR, f'comp_{acctime_str}.png')
)
Total running time of the script: ( 0 minutes 51.697 seconds)