Note
Click here to download the full example code
Convert to RGB format (vector data)
This example demonstrates convertion from wind data to uv rgb format (with HKO earth format).
Definitions
Import all required modules and methods:
# Python package to allow system command line functions
import os
# Python package to manage warning message
import warnings
# Python package for time calculations
import pandas as pd
# Python package for numerical calculations
import numpy as np
# Python package for image generation
from PIL import Image
# Python package for image preview
import matplotlib.pyplot as plt

# swirlspy iris parser function
from swirlspy.rad.iris import read_iris_grid
# swirlspy regrid function
from swirlspy.preprocess import grid_align
# swirlspy rgb convertion function
from swirlspy.utils.conversion import to_rgb_data, to_hko_earth_format
# directory constants
from swirlspy.tests.samples import DATA_DIR
from swirlspy.tests.outputs import OUTPUT_DIR

warnings.filterwarnings("ignore")

# Logging
start_time = pd.Timestamp.now()
Data directory is already populated. Skipping download and extraction.
Loading radar data
# Specify the basetime
basetime = pd.Timestamp('201902190800')

# Reading the wind data
reflec = read_iris_grid(
    os.path.join(
        DATA_DIR,
        basetime.strftime("iris/ppi/TMS%y%m%d%H%M02.PPIMK3B")
    )
)

initialising_time = pd.Timestamp.now()
Reproject to WGS 84, required for HKO earth format
# calculate x, y step size
y_step = -0.025
x_step = 0.025
y = np.arange(24.5, 20.5, y_step)
x = np.arange(112, 116, x_step)

reflec_wgs84 = grid_align(
    reflec, reflec.attrs['area_def'].proj_str,
    x, y, '+proj=longlat +datum=WGS84 +no_defs'
)

preparation_time = pd.Timestamp.now()
Convert image data into rgb format
# only shape with (y, x) is allowed
data = reflec_wgs84.sel(time=basetime)

# only allow positive values
data = data.where(data >= 0)

# this step is not necessary, depends on any meta data and preprocess is required by your platform
earth_data = to_hko_earth_format(data, coords_dp=3, y_step=y_step, x_step=x_step)
rgb = to_rgb_data(earth_data)

convertion_time = pd.Timestamp.now()
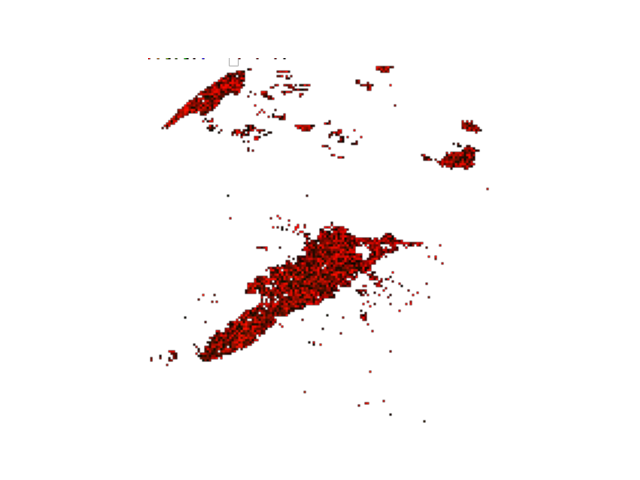
Visualisation
path = os.path.join(OUTPUT_DIR, "rgb_wind.png")
with Image.fromarray(rgb, 'RGBA') as img:
    img.save(path, 'png')

# preview
with Image.open(path) as image:
    plt.axis('off')
    plt.imshow(image)
    plt.plot()
    plt.show()

visualise_time = pd.Timestamp.now()
Checking run time of each component
print(f"Start time: {start_time}")
print(f"Initialising time: {initialising_time}")
print(f"Preparation time: {preparation_time}")
print(f"Convertion time: {convertion_time}")
print(f"Visualise time: {visualise_time}")

print(f"Time to initialise: {initialising_time - start_time}")
print(f"Time to prepare information: {preparation_time - initialising_time}")
print(f"Time to convertion: {convertion_time - preparation_time}")
print(f"Time to visualise: {visualise_time - convertion_time}")

print(f"Total: {visualise_time - start_time}")
Start time: 2026-04-20 20:08:18.209192
Initialising time: 2026-04-20 20:08:18.290417
Preparation time: 2026-04-20 20:08:18.554235
Convertion time: 2026-04-20 20:08:18.567531
Visualise time: 2026-04-20 20:08:18.589949
Time to initialise: 0 days 00:00:00.081225
Time to prepare information: 0 days 00:00:00.263818
Time to convertion: 0 days 00:00:00.013296
Time to visualise: 0 days 00:00:00.022418
Total: 0 days 00:00:00.380757
Total running time of the script: ( 0 minutes 0.429 seconds)