Note
Click here to download the full example code
QPE (Manila)
This example demonstrates how to perform QPE, using raingauge data from Manila and radar data from Subic.
Definitions
Import all required modules and methods:
# Python package to allow system command line functions
import os
# Python package to manage warning message
import warnings
# Python package for time calculations
import pandas as pd
# Python package for numerical calculations
import numpy as np
# Python package for xarrays to read and handle netcdf data
import xarray as xr
# Python package for projection description
import pyproj
from pyresample import get_area_def
# Python package for projection
import cartopy.crs as ccrs
# Python package for land/sea features
import cartopy.feature as cfeature
# Python package for reading map shape file
import cartopy.io.shapereader as shpreader
# Python package for creating plots
from matplotlib import pyplot as plt
# Python package for colorbars
from matplotlib.colors import BoundaryNorm, ListedColormap

# swirlspy raingauge data object
from swirlspy.obs import Rain
# swirlspy Philippine UF file parser function
from swirlspy.rad.uf_ph import read_uf_ph
# swirlspy raingauge data interpolate and blending
from swirlspy.qpe.rfmap import rg_interpolate, comp_qpe, show_raingauge
# swirlspy test data source locat utils function
from swirlspy.qpe.utils import timestamps_ending, locate_file
# swirlspy standardize data function
from swirlspy.utils import FrameType, standardize_attr, conversion
# directory constants
from swirlspy.tests.samples import DATA_DIR
from swirlspy.tests.outputs import OUTPUT_DIR

warnings.filterwarnings("ignore")
plt.switch_backend('agg')
Initialising
This section demonstrates extracting raingauge and radar data.
Step 1: Defining an end-time for accumulating rainfall.
acctime = pd.Timestamp('20180811112000').floor('min')
acctime_str = acctime.strftime('%Y%m%d%H%M')
Step 2: Setting up directories for raingauge and radar files.
rad_dir = os.path.join(DATA_DIR, 'uf_ph/sub')
rg_dir = os.path.join(DATA_DIR, 'rfmap')
Step 3: Generating timestamps and pattern for both radar and raingauge files.
# Timestamps of raingauges
rg_timestrings = timestamps_ending(
    acctime + pd.Timedelta(minutes=10),
    duration=pd.Timedelta(hours=1),
    interval=pd.Timedelta(minutes=10)
)

# Raingauge pattern
rg_pattern = ['rf60m_20'+ts for ts in rg_timestrings]

# Finding time nearest radar file
# to accumulation end time
minute = acctime.minute
nearest_6min = acctime.minute // 10 * 10

nearest_rad_timestamp = pd.Timestamp(
    acctime_str[:-2]+f'{nearest_6min:02}'
)

rad_timestrings = timestamps_ending(
    nearest_rad_timestamp,
    duration=pd.Timedelta(hours=1),
    interval=pd.Timedelta(minutes=10)
)
Step 4: Extracting raingauge and radar files from their respective directories.
located_rg_files = []
for pat in rg_pattern:
    located_rg_files.append(locate_file(rg_dir, pat))


located_radar_files = []
for ts in rad_timestrings:
    located_radar_files.append(locate_file(rad_dir, ts))
Step 5: Read data from raingauge files into a Rain object. Coordinates are geodetic, following that in the files.
rg_object_geodetic = Rain(
    located_rg_files,
    'WGS84',
    duration=pd.Timedelta(minutes=5),
    NAN=[3276.7, 32767]
)
Step 6: Define the target grid as a pyresample AreaDefinition.
# Defining target grid
area_id = "epsg3123_240km"
description = ("A 240 m resolution rectangular grid "
               "centred at Subic RADAR and extending to 240 km "
               "in each direction")
proj_id = 'epsg3123'
projection = ('+proj=tmerc +lat_0=0 '
              '+lon_0=121 +k=0.99995 +x_0=500000 '
              '+y_0=0 +ellps=clrk66 +towgs84=-127.62,-67.24,'
              '-47.04,-3.068,4.903,1.578,-1.06 +units=m '
              '+no_defs')
x_size = 1000
y_size = 1000
area_extent = (191376.04113, 1399386.68659, 671376.04113, 1879386.68659)
area_def = get_area_def(
    area_id, description, proj_id, projection, x_size, y_size, area_extent
)
Step 7: Convert coordinates of raingauge object to desired projection. In this example, the desired projection is PRS92. This can be achieved by the .reproject() method of the Rain object.
inProj = pyproj.Proj(init="epsg:4326")
outProj = pyproj.Proj(area_def.proj_str)

rg_object = rg_object_geodetic.reproject(inProj, outProj, "PRS92")
Step 8: Read radar files into xarray.DataArrays using read_uf_ph().
reflec_list = []
for file in located_radar_files:
    reflec = read_uf_ph(
        file, area_def=area_def,
        coord_label=['easting', 'northing'],
        indicator='deg_ppi', elevation=0.5
    )

    reflec_list.append(reflec)

reflectivity = xr.concat(reflec_list, dim='time')
standardize_attr(reflectivity, frame_type=FrameType.dBZ)
Accumulating and interpolating rainfall
Interpolate rainfall recorded by raingauges into the user-defined grid and accumulate radar rainfall over an hour after making the necessary adjustments.
Step 1: Interpolate Rain object to user-defined grid. In this example, a multiquadric Radial Basis Function is used.
interpolated_rg = rg_interpolate(
    rg_object, area_def, 'rbf',
    coord_label=['easting', 'northing']
)
Step 2: Convert to radar reflectivity to rainrates, convert rainrates to times of raingauges, and accumulate rainfalls every 10 minutes.
rainrates = conversion.to_rainfall_rate(reflectivity, False, a=300, b=1.4)

# Convert time coordinates of rainrates from start time
# to end time
rainrates_time_endtime = rainrates.copy()
rainrates_time_endtime.coords['time'] = \
    [
        pd.Timestamp(t) + pd.Timedelta(minutes=10)
        for t in rainrates.coords['time'].values
]

standardize_attr(rainrates_time_endtime, frame_type=FrameType.mmph)
rainfalls = conversion.to_rainfall_depth(rainrates_time_endtime)
Step 3: Accumulate rainfall over an hour.
acc_rf = conversion.acc_rainfall_depth(
    rainfalls,
    rg_object.end_time,
    rg_object.end_time,
    pd.Timedelta(minutes=60)
)
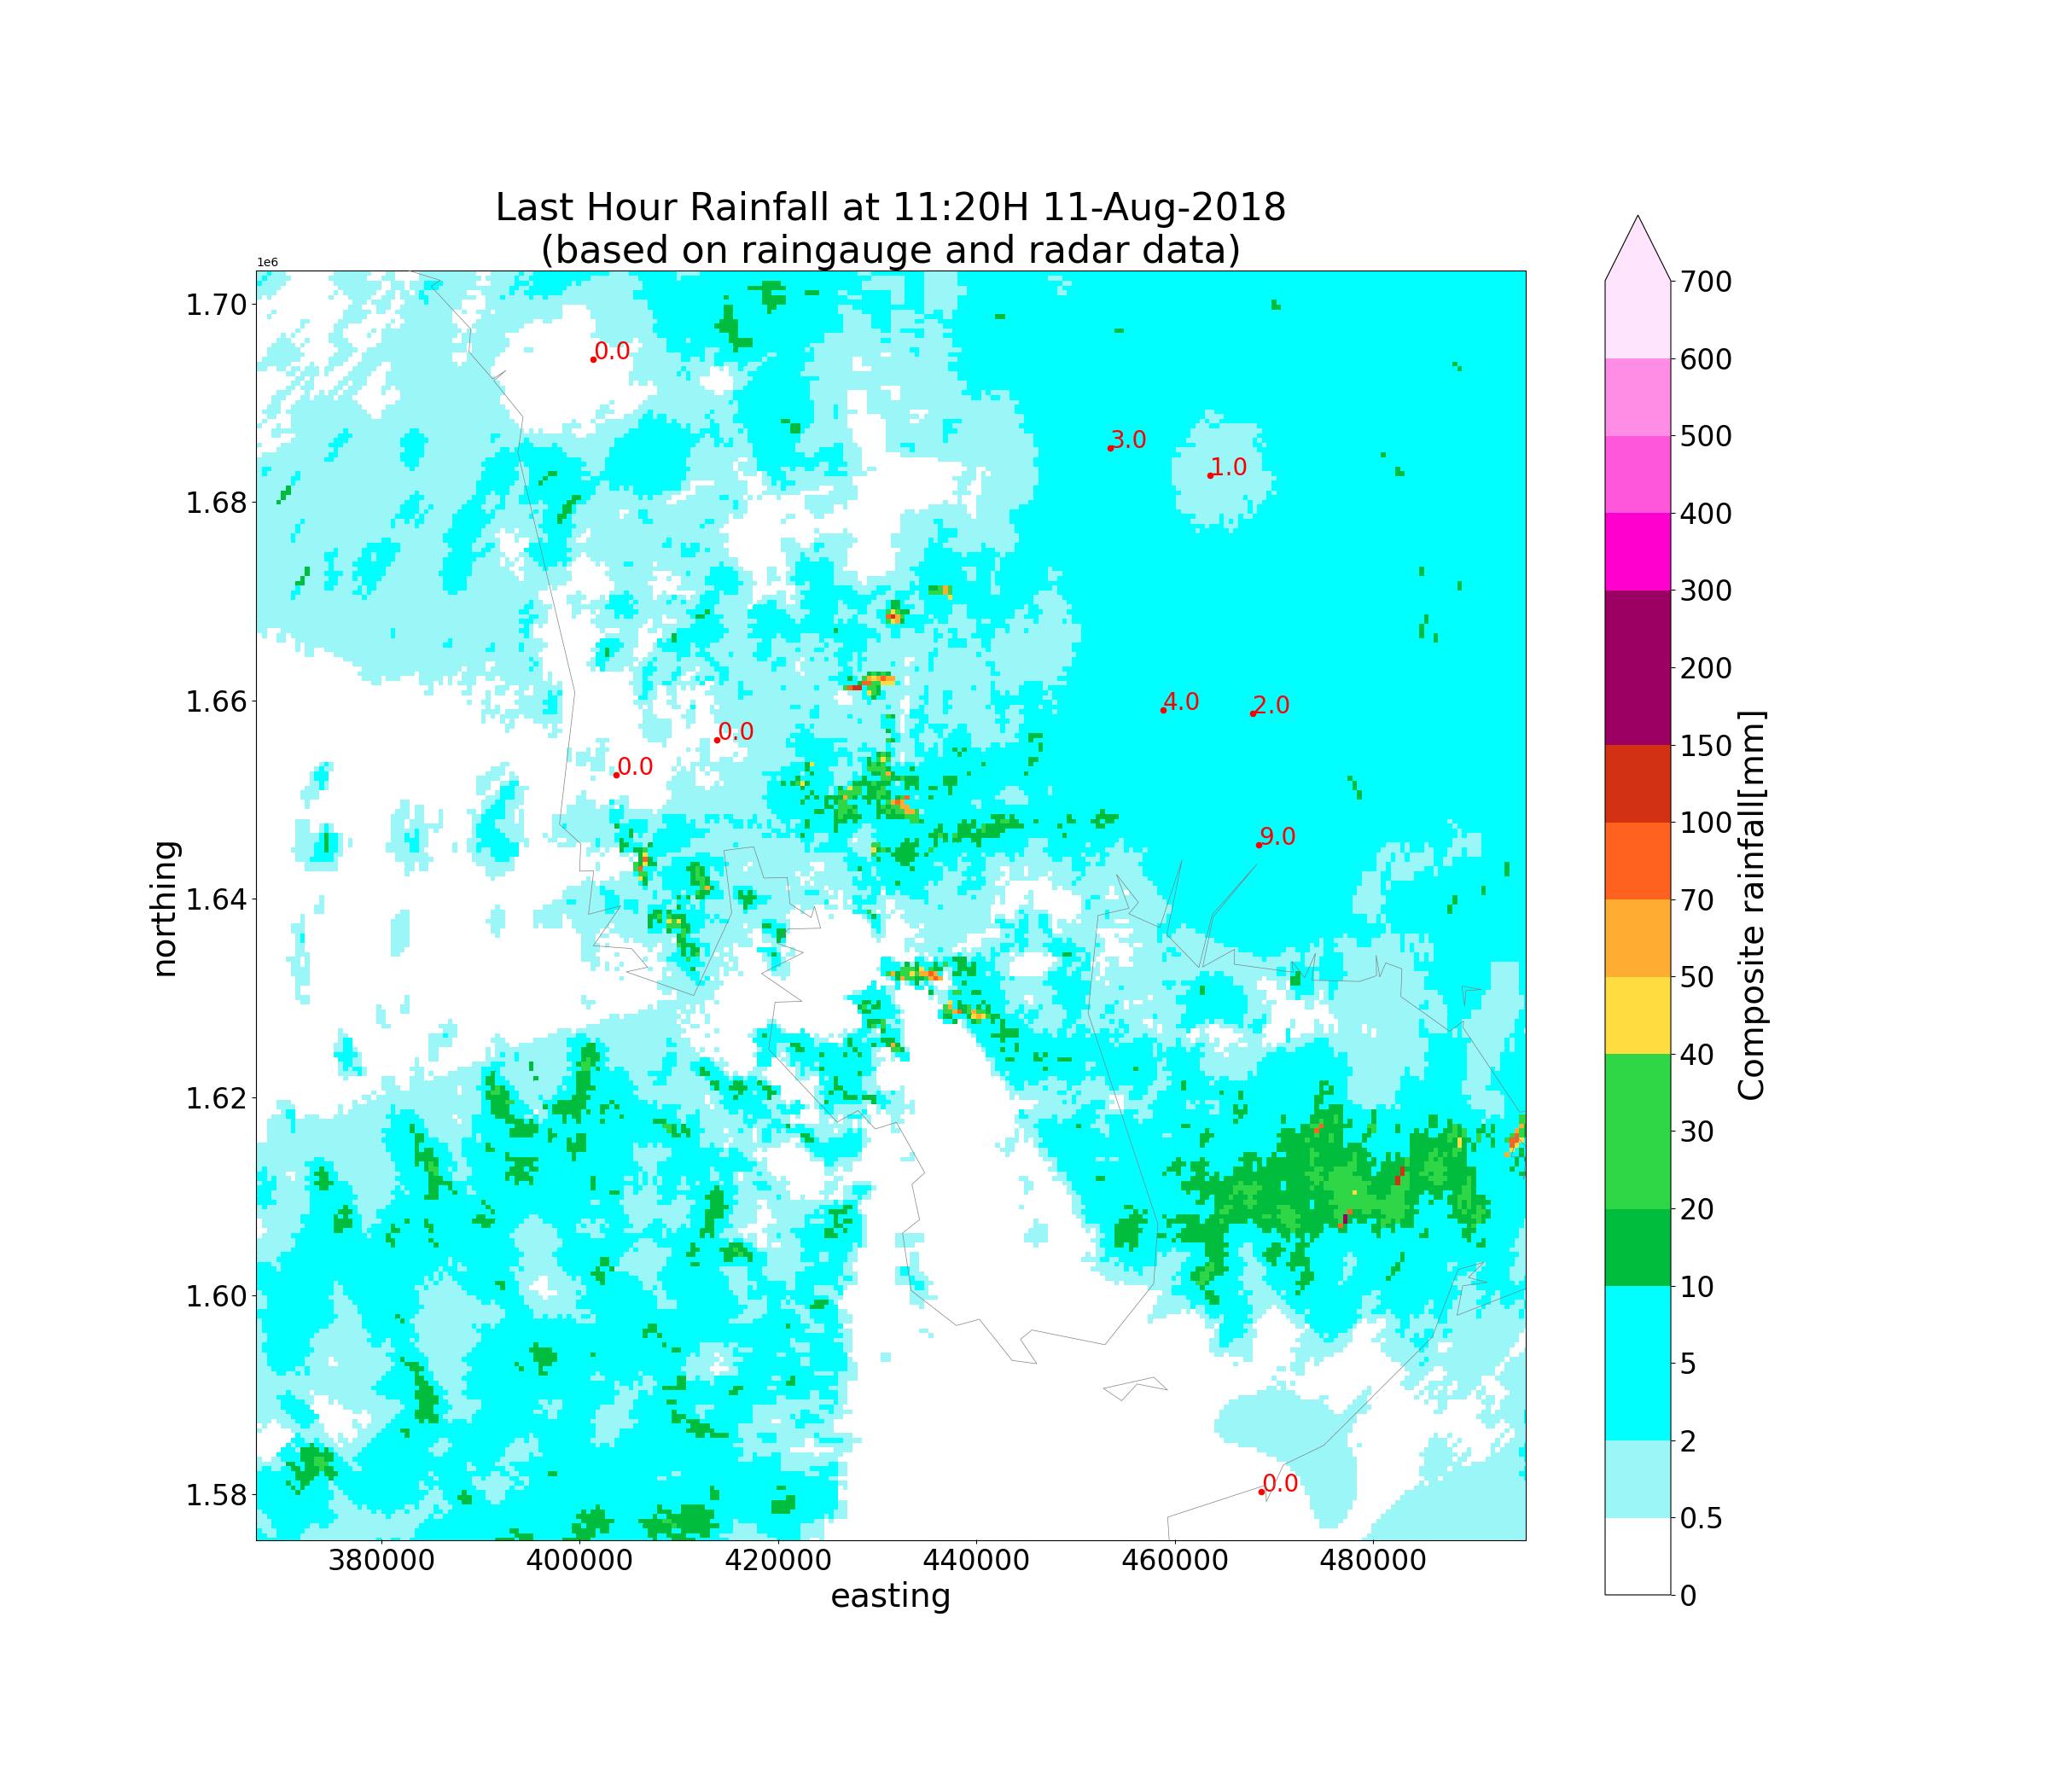
Compositing rainfall
Perform compositing on radar and raingauge derived rainfall to obtain a composite QPE.
comprf = comp_qpe(
    area_def,
    rg_object=rg_object,
    rg_interp=interpolated_rg,
    rad_rf=acc_rf
)
Plotting
Plot composited radar and raingauge rainfall.
# Defining coastlines
map_shape_file = os.path.join(DATA_DIR, "shape/rsmc")
ocean_color = np.array([[[178, 208, 254]]], dtype=np.uint8)
land_color = cfeature.COLORS['land']
coastline = cfeature.ShapelyFeature(
    list(shpreader.Reader(map_shape_file).geometries()),
    ccrs.PlateCarree()
)

# Plotting function for neatness.


def plot_map(
    da, rg_object, acctime, area_def,
    based='raingauge and radar',
    savepath='', area_extent=None
):
    """
    A custom function for plotting a map.

    Parameters
    --------------
    da: xarray.DataArray
        Contains data to be plotted.
    rg_object: Rain
        Contains raingauge data.
    acctime: pd.Timestamp
        Contains the endtime of the accumulation
        period.
    area_def: pyresample.geometry.AreaDefinition
        AreaDefinition of the grid.
    based: str
        Type of data plotted in the map.
    savepath: str
        Path to save the image to.
    area_extent: tuple
        Area extent (x0, x1, y0, y1) to be plotted.
        Defaults to None.

    """
    # Defining the colour scheme
    levels = [
        0, 0.5, 2, 5, 10, 20,
        30, 40, 50, 70, 100, 150,
        200, 300, 400, 500, 600, 700
    ]

    cmap = ListedColormap([
        '#ffffff', '#9bf7f7', '#00ffff', '#00d5cc', '#00bd3d', '#2fd646',
        '#9de843', '#ffdd41', '#ffac33', '#ff621e', '#d23211', '#9d0063',
        '#e300ae', '#ff00ce', '#ff57da', '#ff8de6', '#ffe4fd'
    ])

    norm = BoundaryNorm(levels, ncolors=cmap.N, clip=True)

    # Plotting axes
    plt.figure(figsize=(24, 21))
    crs = area_def.to_cartopy_crs()
    ax = plt.axes(projection=crs)

    if area_extent is not None:
        ax.set_extent(area_extent, crs=crs)

    # Plot data
    quadmesh = da.plot(
        cmap=cmap,
        norm=norm,
        extend='max',
        cbar_kwargs={'ticks': levels, 'format': '%.3g'}
    )

    # Adjusting size of colorbar
    cb = quadmesh.colorbar
    cb.ax.set_ylabel(
        da.attrs['long_name']+'['+da.attrs['units']+']',
        fontsize=28
    )

    cb.ax.tick_params(labelsize=24)

    # Setting labels
    ax.xaxis.set_visible(True)
    ax.yaxis.set_visible(True)

    try:
        for tick in ax.xaxis.get_major_ticks():
            tick.label.set_fontsize(24)
    except AttributeError:
        for label in ax.xaxis.get_ticklabels():
            label.set_fontsize(24)
    try:
        for tick in ax.yaxis.get_major_ticks():
            tick.label.set_fontsize(24)
    except AttributeError:
        for label in ax.yaxis.get_ticklabels():
            label.set_fontsize(24)
    ax.xaxis.label.set_size(28)
    ax.yaxis.label.set_size(28)

    # ocean
    ax.imshow(np.tile(ocean_color, [2, 2, 1]),
              origin='upper',
              transform=ccrs.PlateCarree(),
              extent=[-180, 180, -180, 180],
              zorder=-1)
    # coastline, color
    ax.add_feature(coastline,
                   facecolor=land_color, edgecolor='none', zorder=0)
    # overlay coastline without color
    ax.add_feature(coastline, facecolor='none',
                   edgecolor='gray', linewidth=0.5, zorder=3)

    # Show raingauge
    show_raingauge(
        rg_object, ax, show_value=True, color='red', markersize=20,
        fontsize=20
    )
    # Show title
    plt.title(
        (f"Last Hour Rainfall at {acctime.strftime('%H:%MH %d-%b-%Y')}\n"
         f"(based on {based} data)"),
        fontsize=32
    )

    plt.savefig(savepath)
# Plotting maps
r = 64000
proj_site = reflectivity.proj_site
area_extent = (
proj_site[0]-r,
proj_site[0]+r,
proj_site[1]-r,
proj_site[1]+r
)
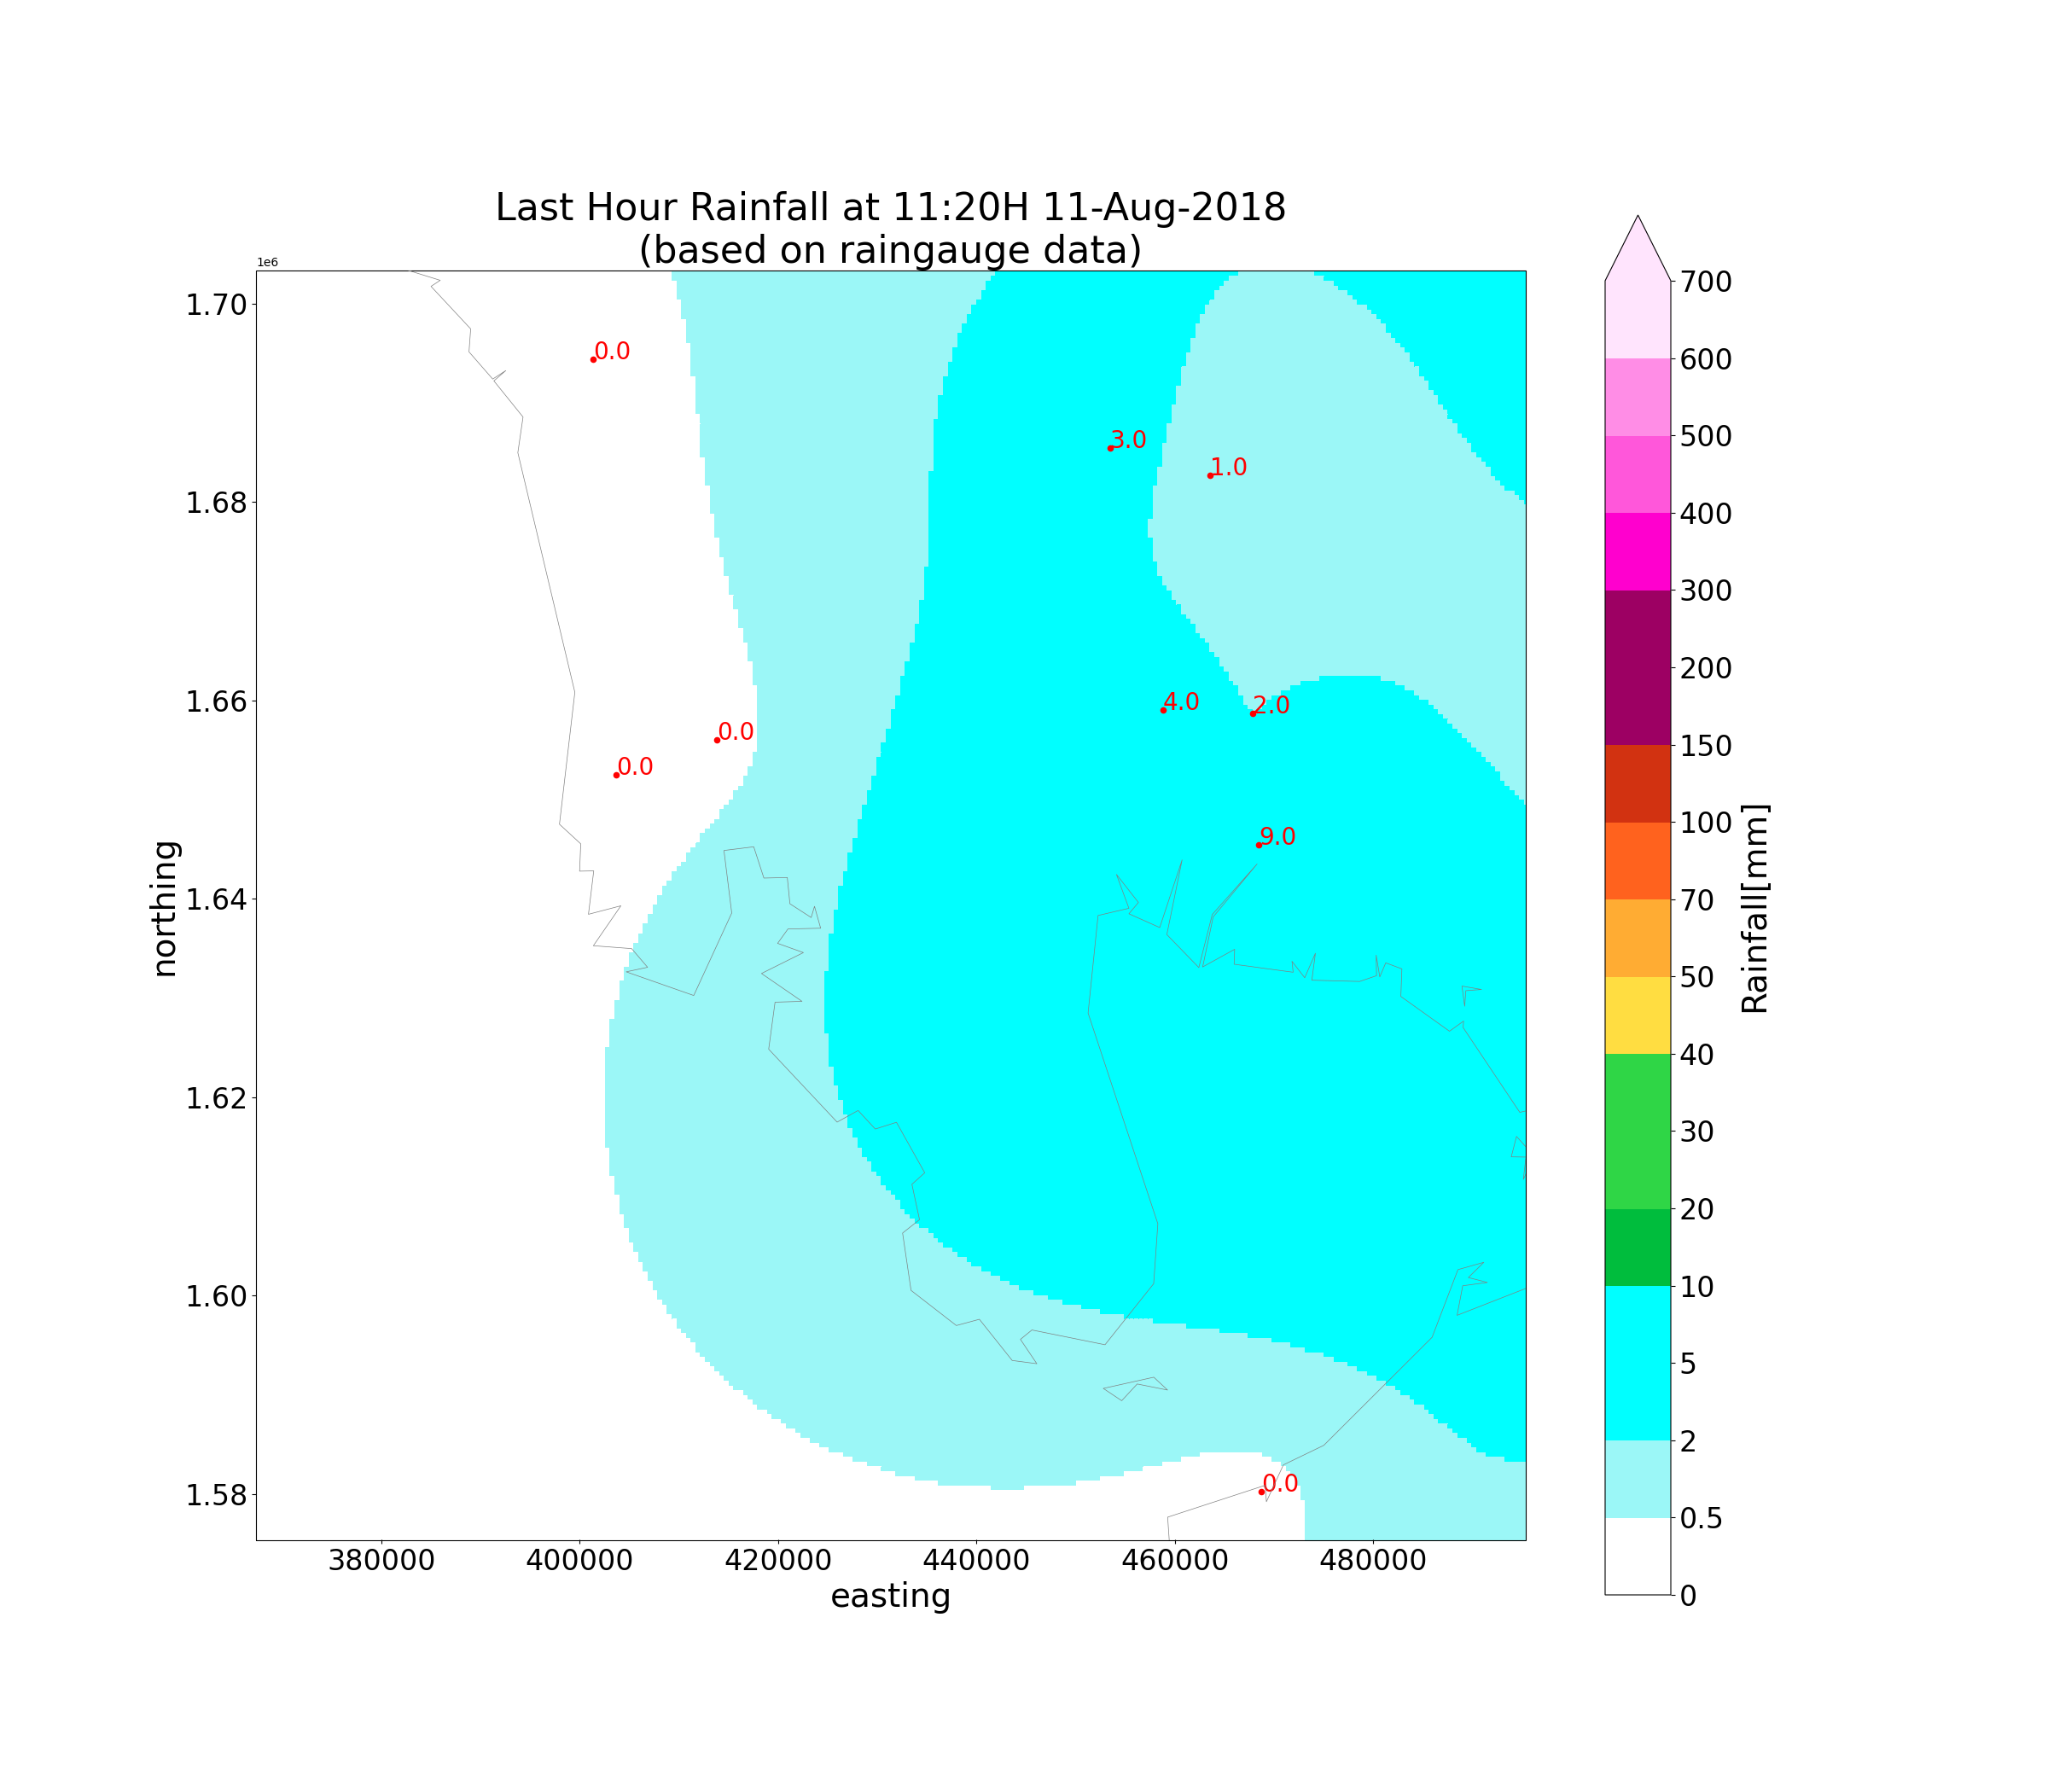
# Raingauge only
plot_map(
interpolated_rg, rg_object,
acctime, area_def,
based='raingauge',
savepath=os.path.join(OUTPUT_DIR, f'raingauge_{acctime_str}.png'),
area_extent=area_extent
)
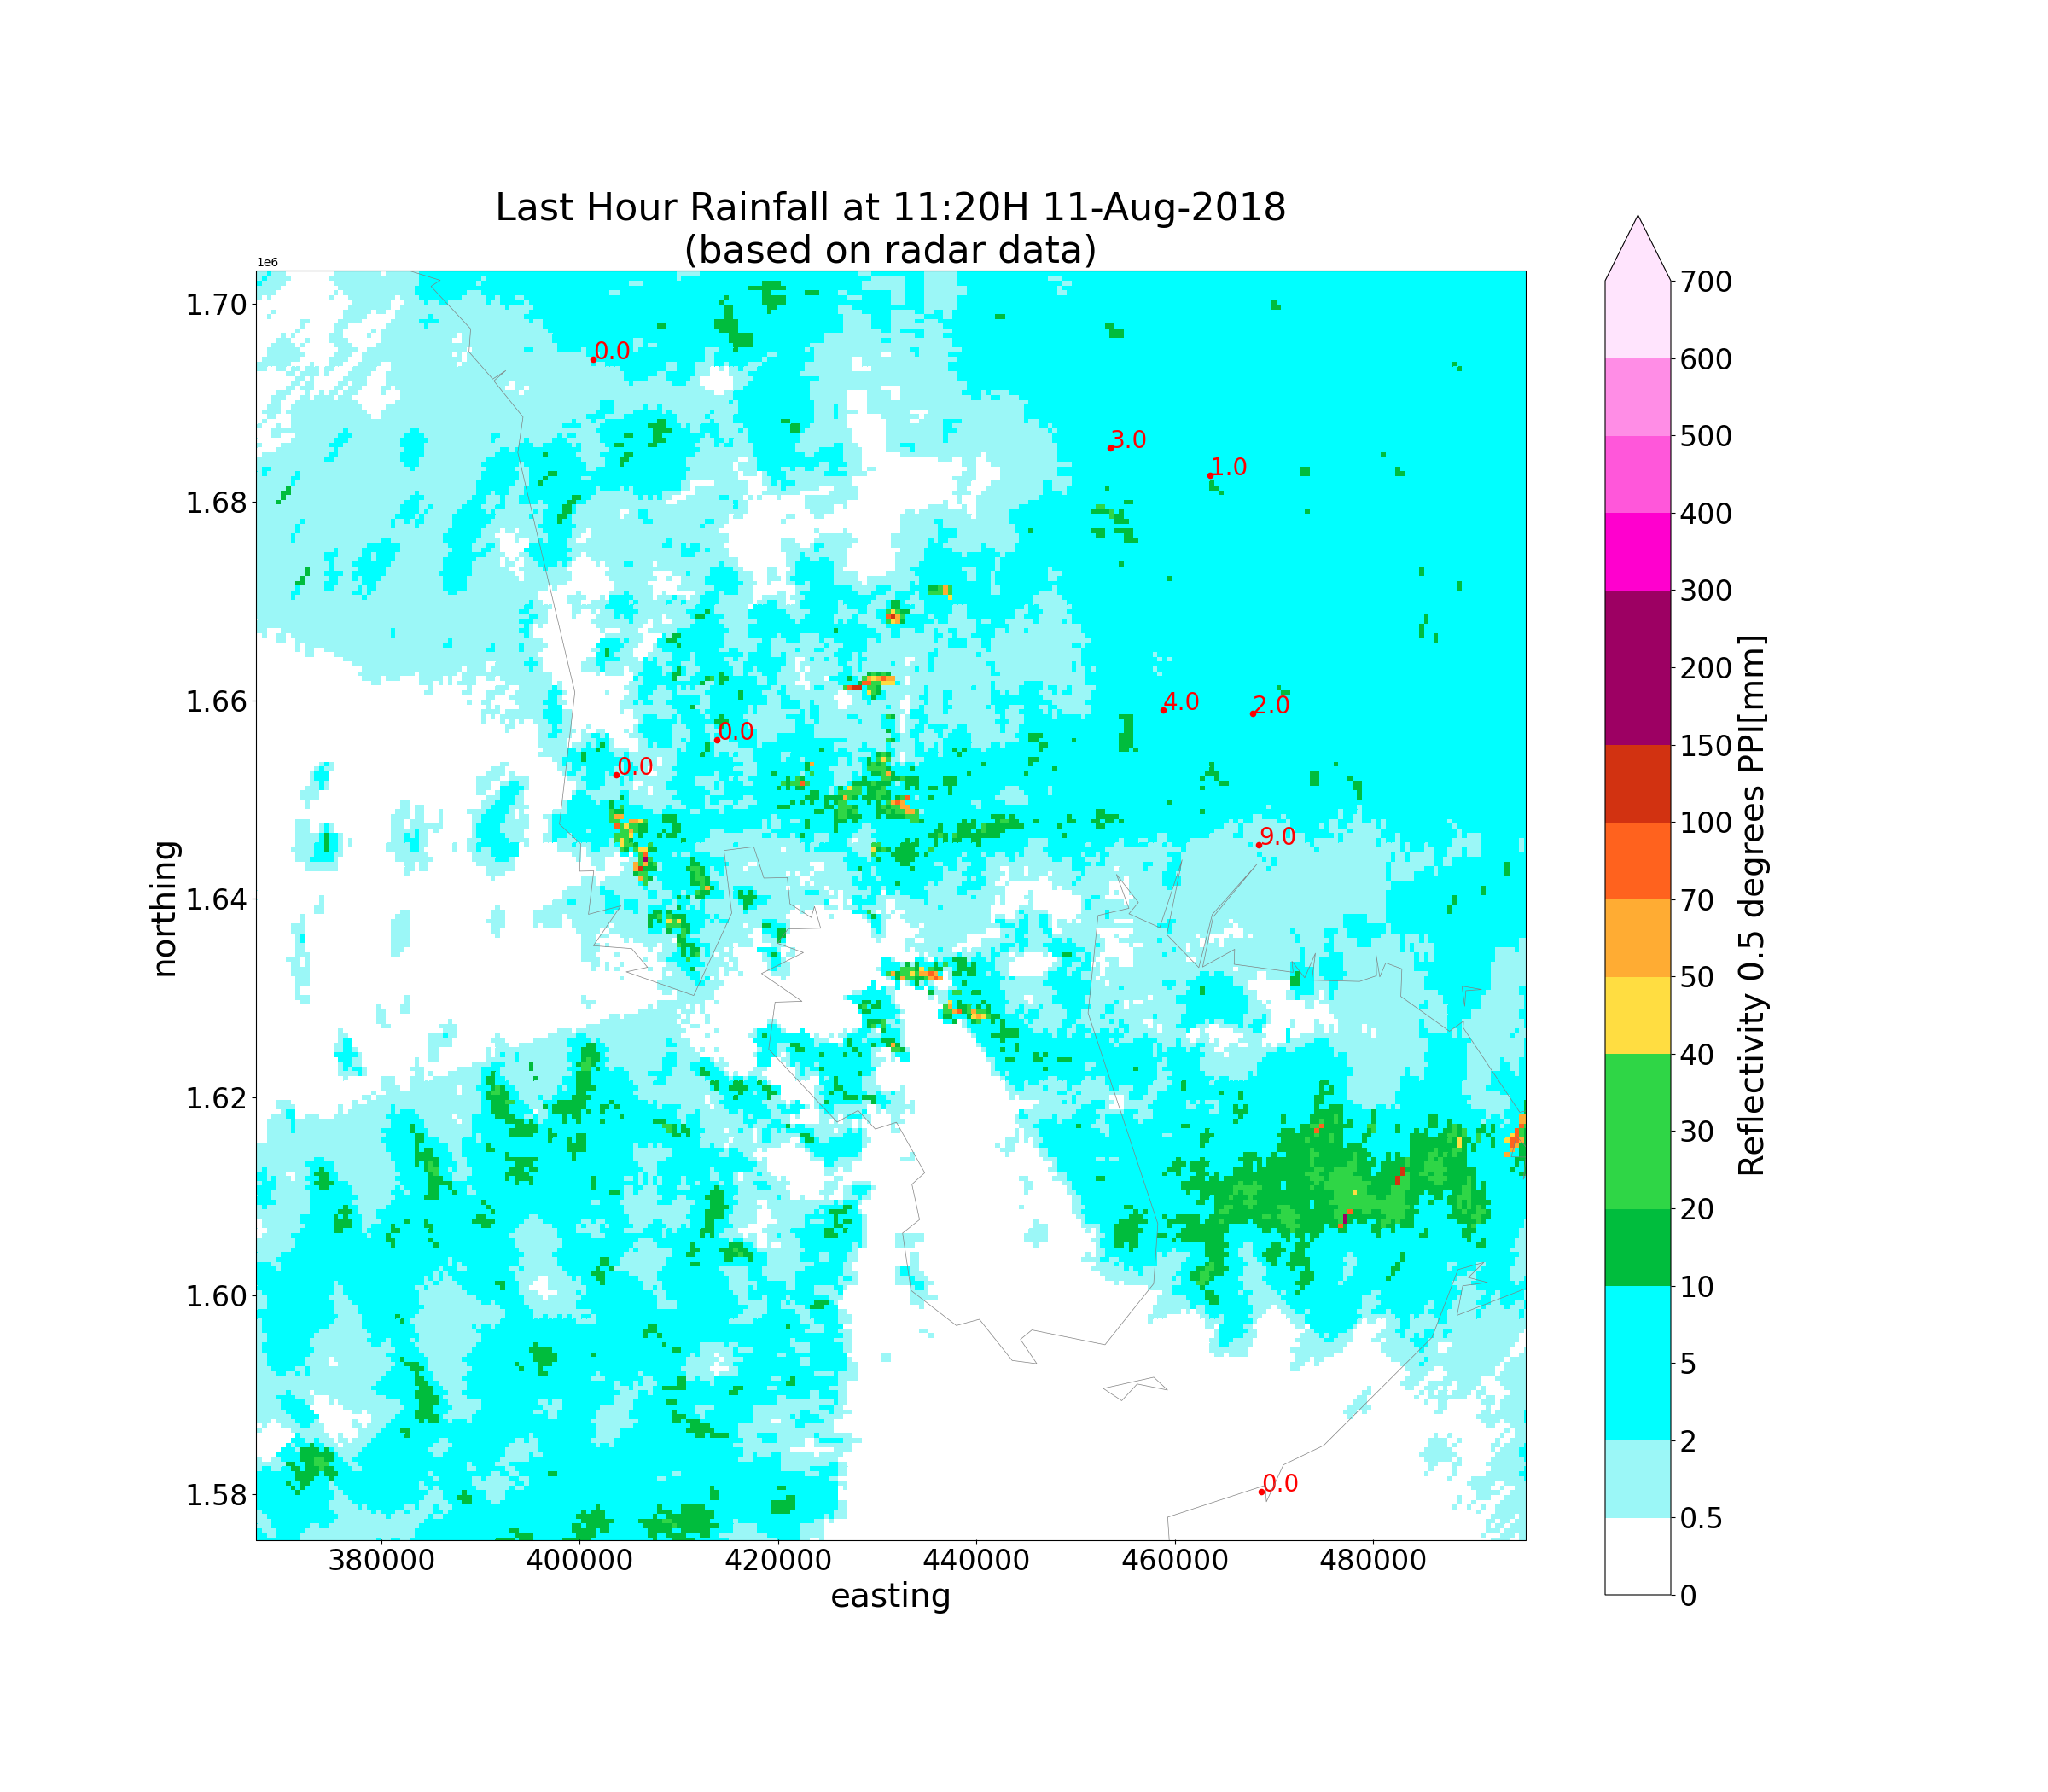
# Radar only
plot_map(
acc_rf, rg_object,
acctime, area_def,
based='radar',
savepath=os.path.join(OUTPUT_DIR, f'radar_{acctime_str}.png'),
area_extent=area_extent
)
# Composite raingauge and radar
plot_map(
comprf, rg_object,
acctime, area_def,
savepath=os.path.join(OUTPUT_DIR, f'comp_{acctime_str}.png'),
area_extent=area_extent
)
Total running time of the script: ( 0 minutes 43.865 seconds)